BIM Pars is a Revit extension developed using Python within the pyRevit
 environment, functioning as an app designed to simplify complex workflows by automating tasks. This tool is primarily focused on BIM and data processing within a Revit model, but can be beneficial for various other users, including planners and anyone who works with Revit. BIM Pars is an open-source application, offering users an enhanced, customizable experience.
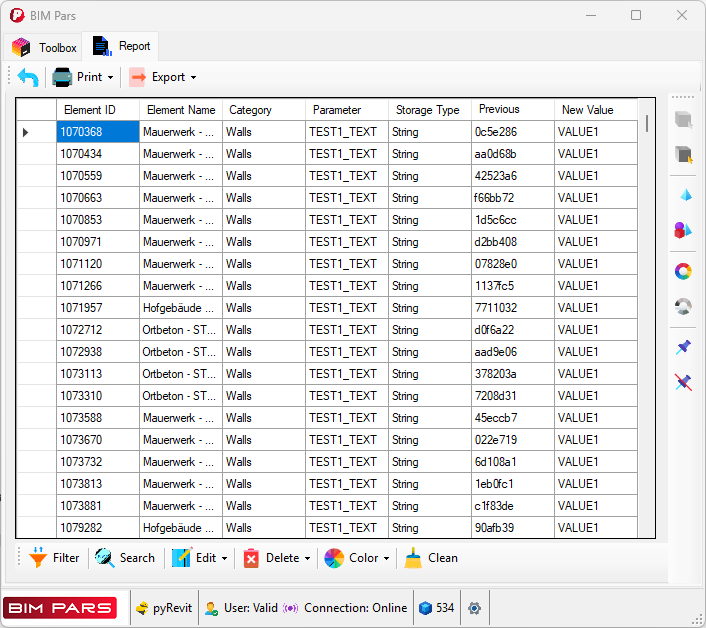
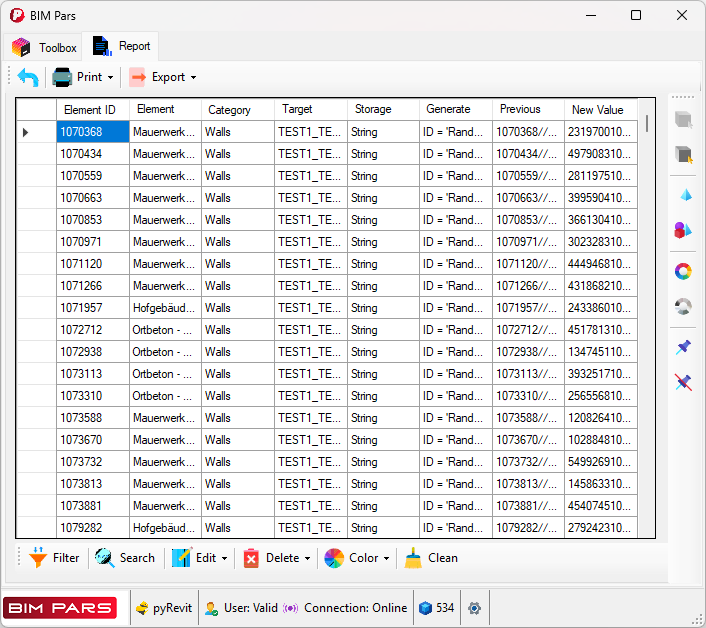
BIM Pars generates reports in the form of data grids, which include the necessary data and modifications based on the tools executed within the app.
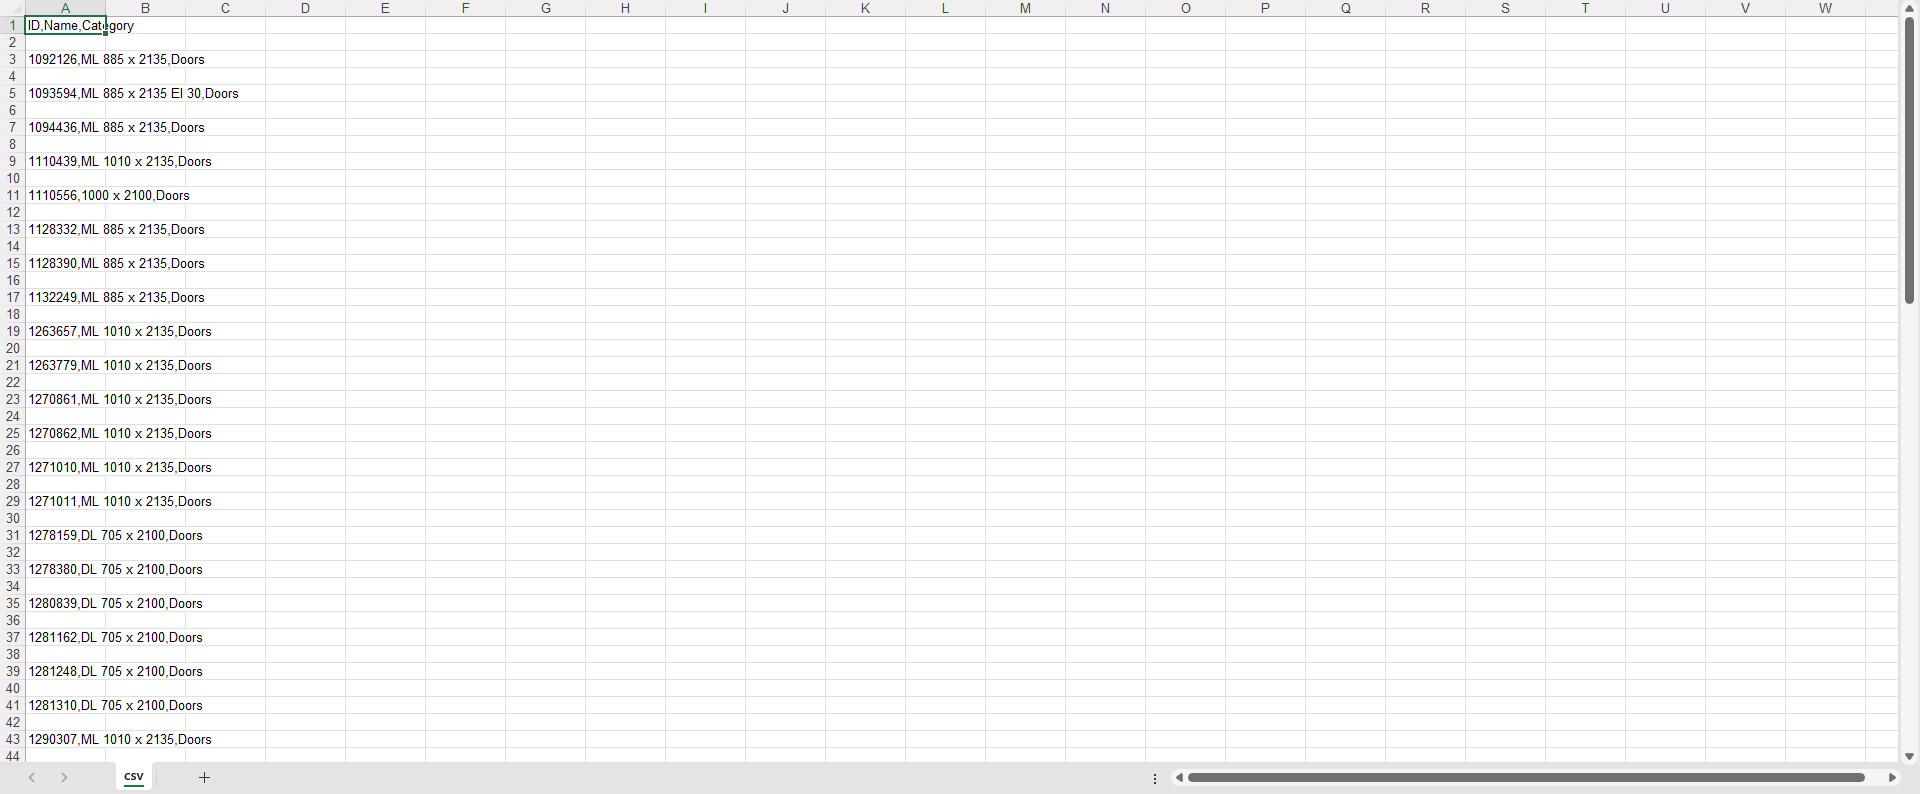
Users can search, add, remove columns and rows, filter data, and apply color coding to better identify specific data points. The reports can be exported to formats such as HTML, XLSX, or CSV.
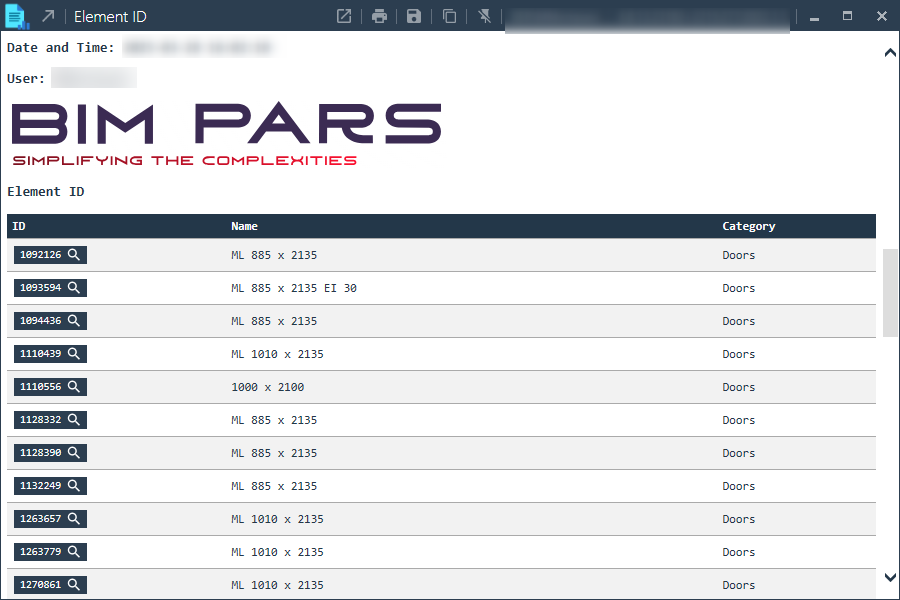
Reports can be printed in the pyRevit output window, with an optional user-defined logo at the report header. The output can then be saved as PDF or HTML.
BIM Pars can import and display any HTML file in the pyRevit output window, making it easy to view previous reports stored in HTML format.
Users can manage selections without altering the Revit model. Actions like filter, store, import, export, and load selections are available without changing the model itself.
BIM Pars supports custom Python scripts, enabling users to add, delete, and run scripts directly within the app. Custom documentation and resources such as video links and GitHub references can also be integrated.
BIM Pars supports seven languages, allowing users to switch the app interface and report generation language as needed.
must be installed to run BIM Pars appTo use BIM Pars![]() , a license key is required. This key can be obtained by:
, a license key is required. This key can be obtained by:
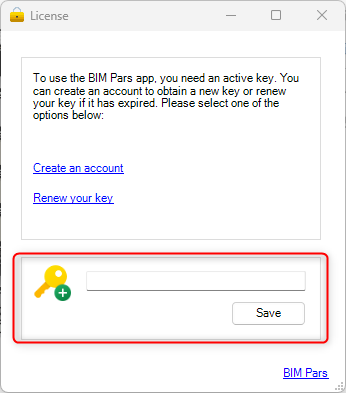
The key is , and you can always access it from the Settings window .
.
The Mode feature allows you to change the appearance and theme of the BIM Pars app![]() .
.
of the app.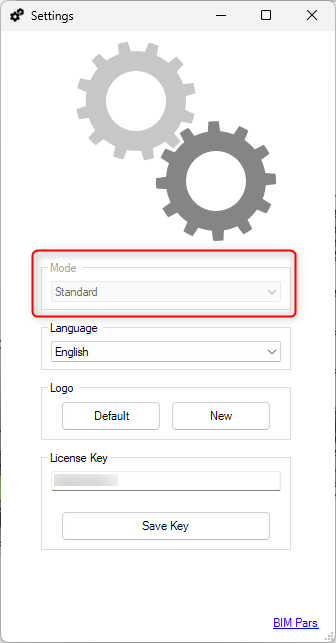
Note: As of BIM Pars V1.0, the Mode functionality is not available. The default mode is set to Mode.
BIM Pars supports seven languages for its user interface and report generation. Changing the language of the app does not affect Revit's language settings.
Supported Languages:
.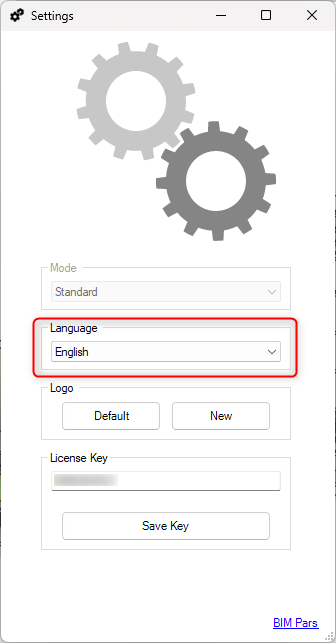
Default Language:
One of BIM Pars’ unique features is the ability to customize the logo that appears in reports. By default, reports generated in BIM Pars will include the BIM Pars heading logo. However, users can replace this with their own logo.
 .
.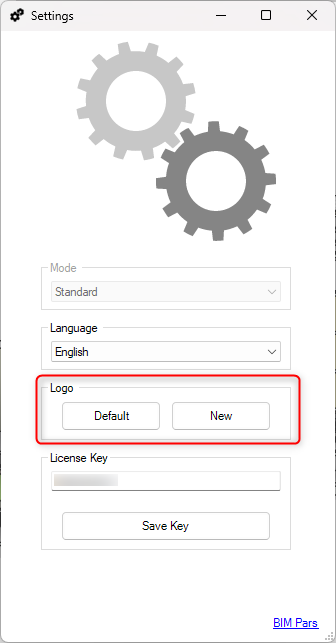
If you wish to revert to the default settings, including the logo, click in the Settings window.
The default configuration for BIM Pars upon installation is as follows:
These default settings can be customized as needed through the Settings window
BIM Pars V1.0 consists of two main tabs: ToolBox Tab and Report Tab
 .
.
: This tab provides access to all tools and actions within the app. It remains active until a tool that generates a report is executed.: This tab only appears when you activate a tool that generates a report. It is a
temporary tab, and while active, the ToolBox Tab is
deactivated. This design prevents the accidental initiation of another tool while a report is still being processed. To return to the ToolBox Tab, click the
Back Button , located on the top toolstrip of the Report Tab.
 or Print
 the report before closing the tab if you need it later.
BIM Pars features two key toolstrips:
The Information Bar is located at the bottom edge of the main window and is always visible. It contains several key pieces of information:

 & Connection Status
 : Shows the status of the current user session.
 : Displays the count of elements in the current selection.: Opens the settings window to configure app preferences.
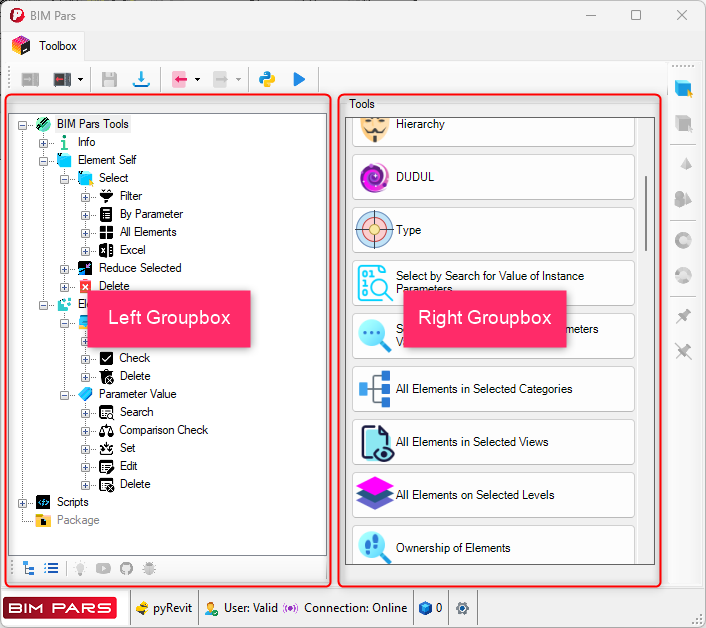
The ToolBox Tab contains two main groupboxes: Left Groupbox and Right Groupbox .

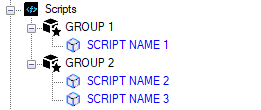
The Script Node Tree Structure : is user-based, meaning it contains custom scripts that the user has added through the Script Manager
 . These scripts are organized into groups and sub-groups, allowing for easy navigation and execution. Each script in the tree can be configured with:
To configure script node, a JSON file must be used. If the JSON file is not created, all user-added scripts will be listed under the Script Node with inactive documentation, YouTube, and repository buttons. Report Bug is only active for BIM Pars tools
 .
.
Creating JSON for Scripts: See the Collection section for details.
The Memory Tool allows users to store selections of elements without affecting the Revit model. This feature is helpful when managing selections across different projects.
You can add multiple selections to memory, which will combine into one selection for the project. These selections are stored locally within BIM Pars and will remain in the app even if you close Revit.
Steps:
 in the Top Toolstrip of the ToolBox Tab.
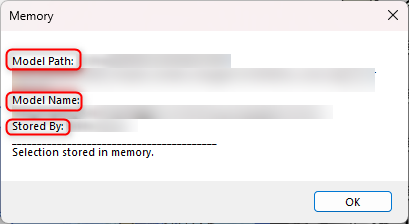
When you load selections from memory, the current selection will be replaced with the memory selection. If you have elements already selected, they will be deselected when loading memory.
Steps:
 dropdown in the ToolBox Tab.
 .
.This option removes elements in the current selection that are also in memory, retaining the rest of the elements in the current selection.
Steps:
in the ToolBox Tab. .
.You can also save selections individually within the ToolBox Tab, similar to how memory functions but with the ability to assign custom names and notes.
Steps:
 in the Top Toolstrip.
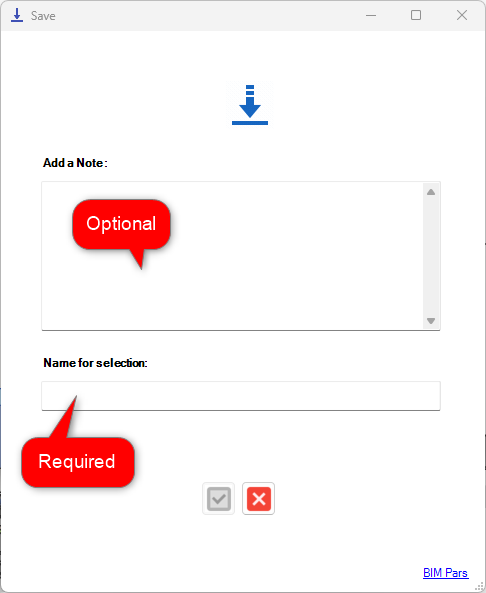
Steps:
 in the Top Toolstrip.
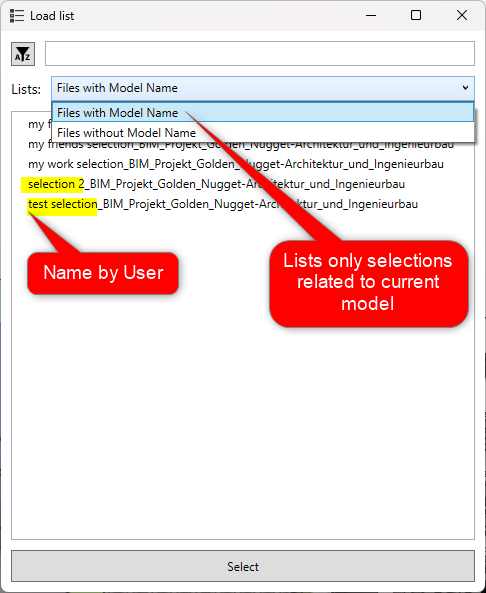
BIM Pars allows you to import selections and reports using various formats, including HTML and XML.
You can import any HTML file into the Output Window. This can include previous reports saved in HTML format.
Steps:
 in the ToolBox Tab.
 option.
Import selections stored in XML files, which contain element IDs and optional notes. Ensure that the imported XML file follows the correct BIM Pars structure, or the import will fail.
Steps:
in the ToolBox Tab. option.
Export selected elements as XML or CSV files.
Export elements with a note for future import.
Steps:
in the ToolBox Tab.option.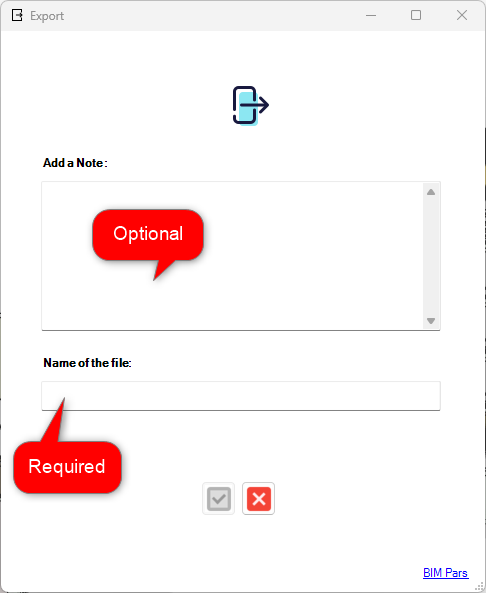
Lists element IDs in a column (cannot be re-imported directly into BIM Pars).
in the ToolBox Tab. option.
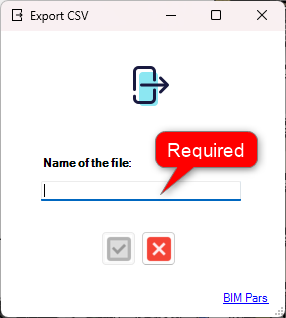
BIM Pars allows you to execute custom Python scripts and manage them through the Script Manager. Also you can assign relevant documentation, videos, and GitHub repositories via JSON files.
Enables users to set a directory for scripts and execute them directly from within BIM Pars. Users can also add or remove scripts from the list.
Steps:
in the
Top
Toolstrip
.
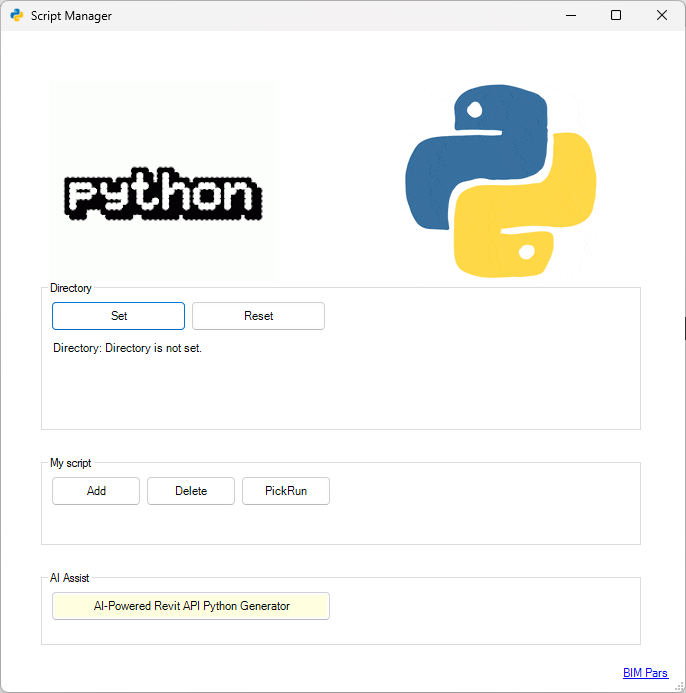
Executes all scripts from the specified directory. If more than one script is in the directory, you will be prompted to choose which script to run.
Steps:
 in the Top Toolstrip.
BIM Pars app![]() uses exec() function for execution of scripts.
uses exec() function for execution of scripts.
Steps:
The Right Edge Toolstrip also contains tools for element selection:


Note: These actions are only applicable if there are elements selected in the model. Buttons will be deactivated if no elements are selected.
Select Elements: Selects elements in the model view based on the IDs provided in the report.
Steps:
. in the Right Edge Toolstrip.Deselect Elements: Deselects all currently selected elements.
Steps:
in the Right Edge Toolstrip.Isolate Elements: Isolates the selected elements, hiding all others.
Steps:
in the Right Edge Toolstrip.Revoke Isolation: Restores visibility to all elements.
Steps:
in the Right Edge Toolstrip.Color Elements: Changes the appearance of selected elements by applying a color override.
Steps:
in the Right Edge Toolstrip.Revoke Color: Resets the color of selected elements to their default appearance.
Steps:
in the Right Edge Toolstrip.Pin Elements: Pins the selected elements by plcing a pointer DirectShape, pointing center point of each selected element.
Steps:
in the Right Edge Toolstrip.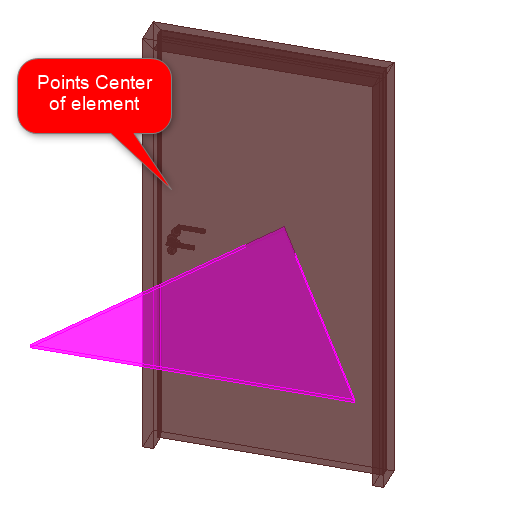
Remove Pin: Removes pins from the selected elements.
Steps:
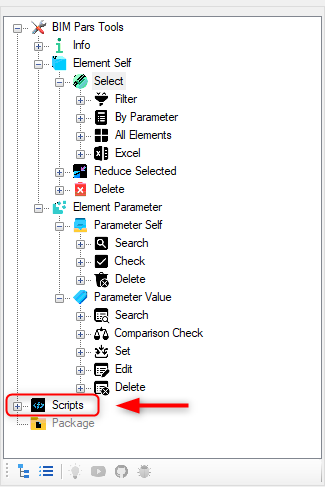
in the Right Edge Toolstrip.BIM Pars contains a variety of tools designed to perform a wide range of actions. These tools are categorized into different groups, and some of these groups have subgroups organized in a tree structure. The tree structure can be found on the left side of the Toolbox tab, which helps users organize and access the tools more efficiently. There are three main nodes in the tree structure: BIM Pars tools, Scripts, and Package . All tools developed by BIM Pars
![]() are listed under BIM Pars tools, while custom scripts developed or collected by users are found under the Scripts node.
are listed under BIM Pars tools, while custom scripts developed or collected by users are found under the Scripts node.
The BIM Pars tools are categorized based on three primary contexts:
 – Tools related to gathering information from elements or models.
 – Tools that interact with or analyze the element itself.
 – Tools dealing with the parameters of elements.
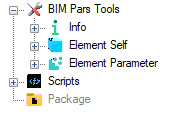
Each of these contexts contains a set of specific tools, ensuring that users can easily find the right tool for their needs.
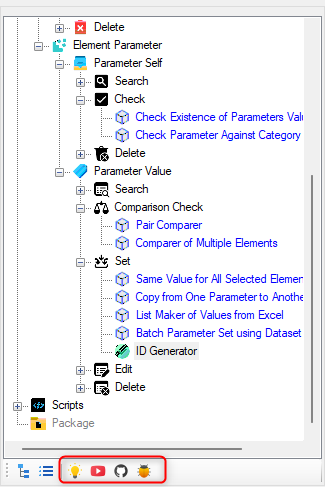
The tree structure comes with a toolstrip that contains six options:
 – Expands the tree structure.
 – Collapses the tree structure.
 – Redirects to the tool’s documentation.
 – Redirects to a relevant YouTube tutorial.
 – Redirects to the GitHub repository for the tool. – Allows users to report any issues with the tool.
To start a tool, users simply need to select a group from the tree structure, and the available tools for that group will appear in the right box of the ToolBox Tab. Clicking on a tool will activate it.
The Info group in the ToolBox Tab is for information tools designed to gather specific information about elements or the model, without making any changes or modifications. Here are the tools available under the Info group:
Purpose: Obtains the Element ID of selected elements.
How to Use:
 tool will obtain the Element ID, Name, and Category of each selected element..
Purpose: Designed for models to find out the creator and owner of an element.
How to Use:
 tool button to run the tool..
Purpose: Gathers various types of information about the model. It offers seven different options to choose from:
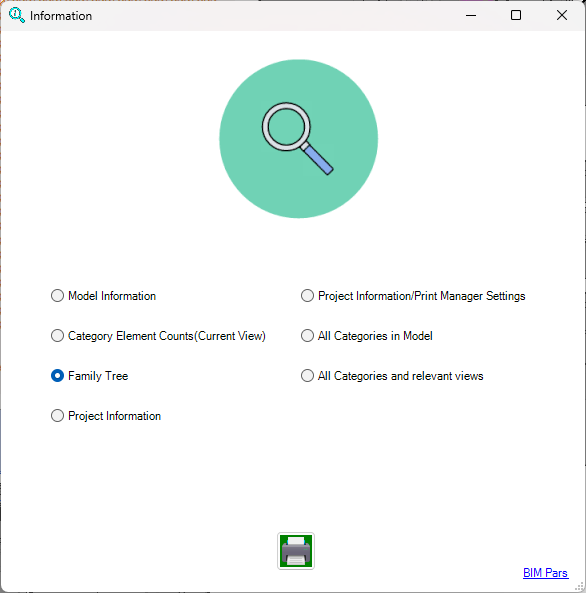
How to Use:
 tool button. button. in a data grid.
Purpose: Obtains information about the currently active view.
How to Use:
 tool button..
Selection Tools are designed to select elements based on different logics and methods. This group contains 4 subgroups:
 : Allows selection of elements based on specified filters.
 : Enables selection of elements based on specific parameters.
 : Selects all elements sharing a common characteristic.
 : Facilitates selection of elements through Excel integration.
All tools under the Selection group and its 4 subgroups perform no transactions or modifications; they only select elements based on their respective logic. Once elements are selected, modifications or transactions can be performed, but the tools themselves only select.
To select elements using filters, there are 3 available filters in BIM Pars app![]() , each with its own logic. These filters can be used to select elements.
, each with its own logic. These filters can be used to select elements.
Purpose: This filter operates on a hierarchical logic aimed at maximizing the number of elements in the selection initially, followed by a reduction in each subsequent step. The process consists of a maximum of 10 steps based on hierarchical logic to filter elements, but you are not required to complete all 10 steps.
How to Use:
 tool button. with their Element ID, Name, and Category.
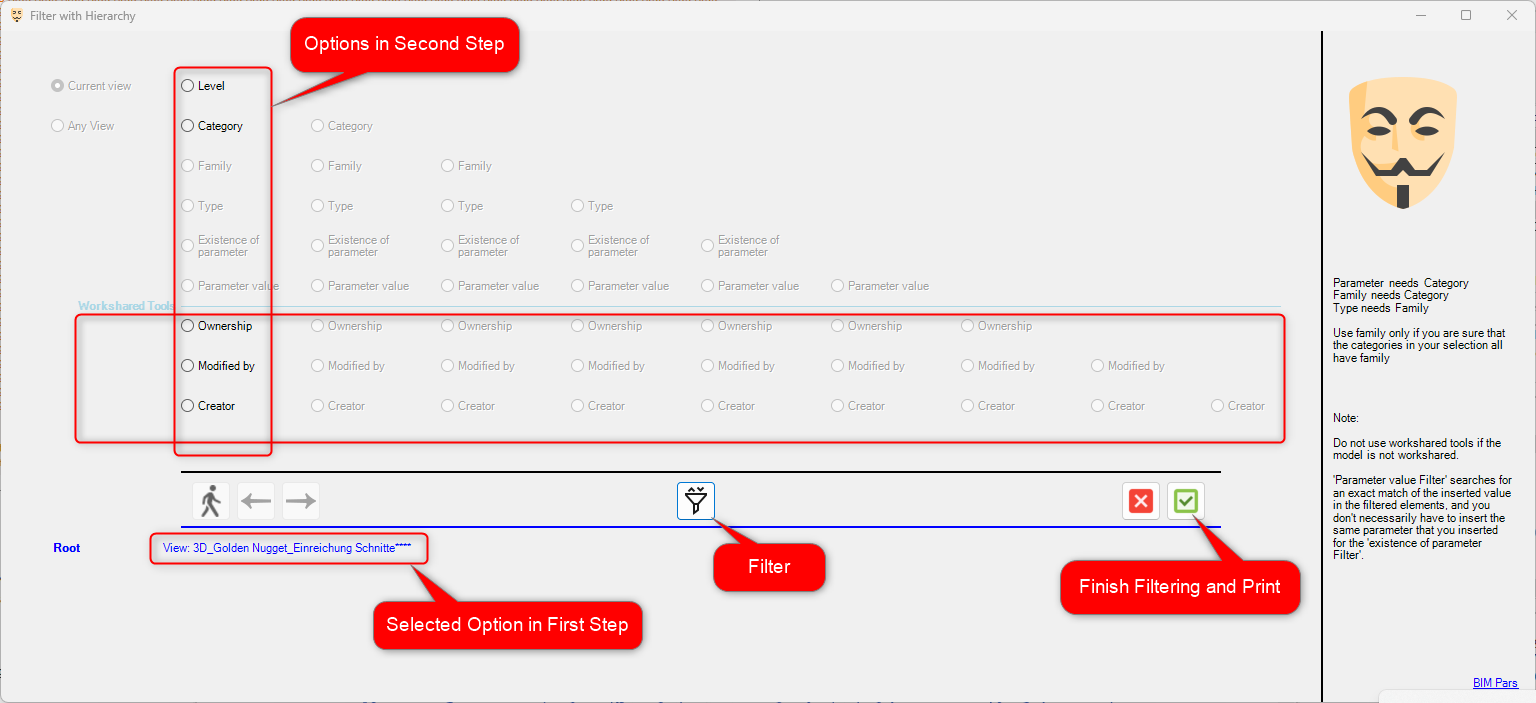
Purpose: Includes 12 methods of filtering, with 2 methods that may increase your selection and 10 that will reduce
 your selection.
Methods:
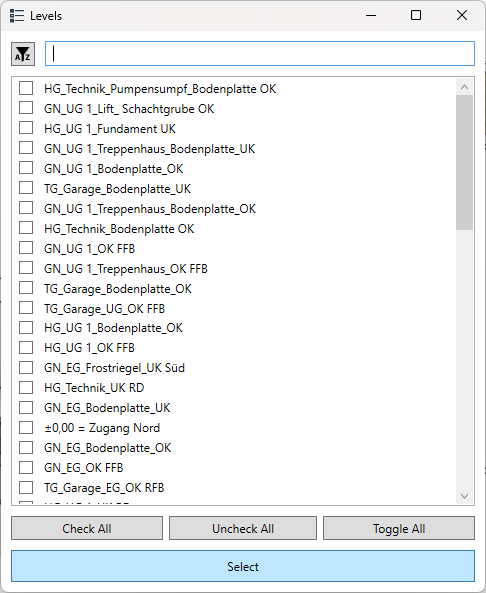
: Can be used even if no element is selected. It will bring all elements from a specific view into the selection. : Requires elements to be selected as referece. This method displays the levels of the elements in the selection and selects all elements of a selected level.: Filters selection to a specific category.: Filters selection to a specific family.: Filters selection to a specific type.: Filters selection to elements that have a specific parameter.: Filters selection based on a specific parameter value.: Filters selection based on a string value in any of the element parameters.: Filters selection based on a numeric value in any of the element parameters.: Filters selection to elements owned by a specific user .: Filters selection to elements last modified by a specific user .: Filters selection to elements created by a specific user .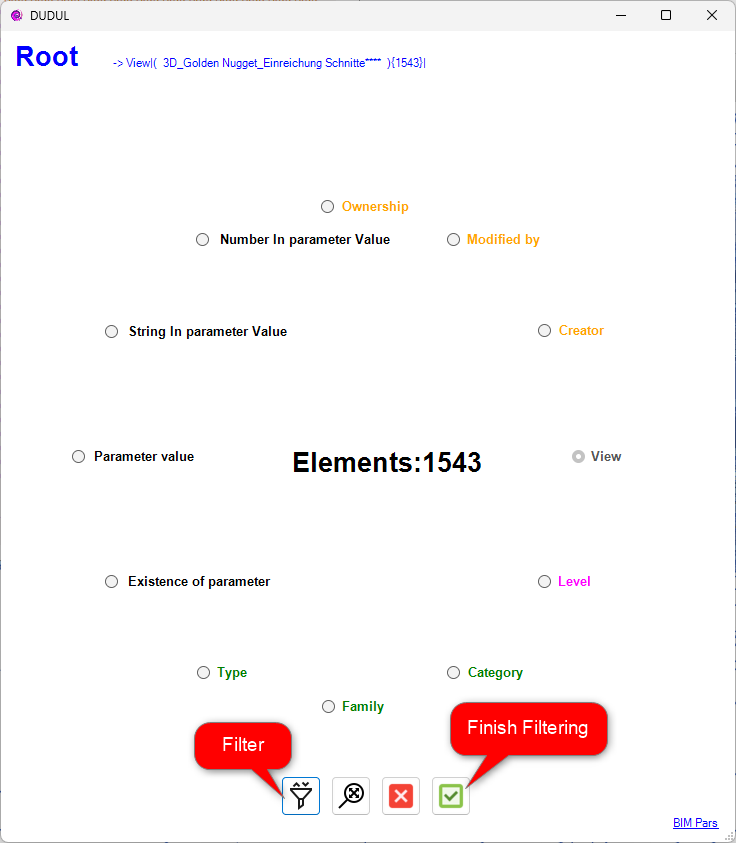
How to Use:
 tool button from the ToolBox Tab. will display their ID, Name, and Category.
Purpose: This filter is based on the characteristics and location of elements, including View, Level, Category, Family, and Type.
How to Use:
 tool button.
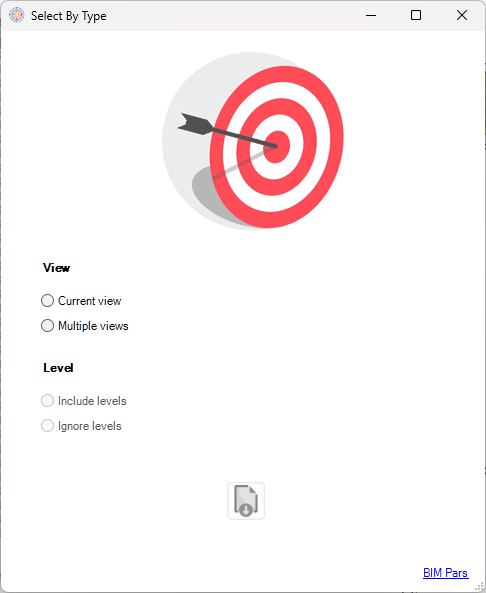 .
.Parent Tool:
Delete Elements by Type Filter
The tools in this group use the parameters of elements as a reference to apply logic and select elements.
Purpose: Allows selecting elements whose specific instance parameter has a specific value.
How to Use:
 tool button from the ToolBox Tab.
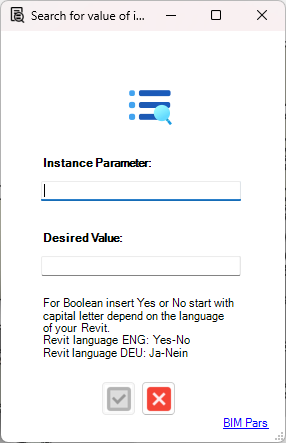 with their ID, Name, Parameter, and Value.
Parent Tools:
Reduce Selection by Searching Value of Instance Parameters
Purpose: Applies three different logic options to select elements based on their parameters. These logic options are:
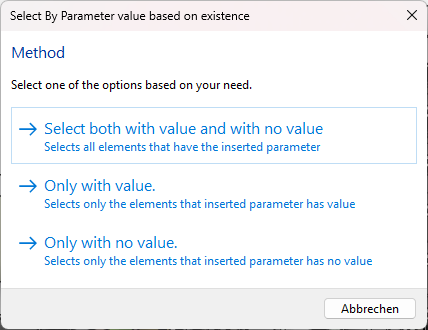
How to Use:
 tool button from the ToolBox Tab and select one of the logic options.
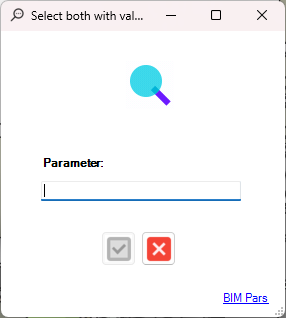
 will show the selected elements with their ID, Name, Parameter, and Value.
Parent Tools:
Reduce Selection by Existence of Parameters Values
The tools in this group are designed to select all elements that share a common characteristic or property.


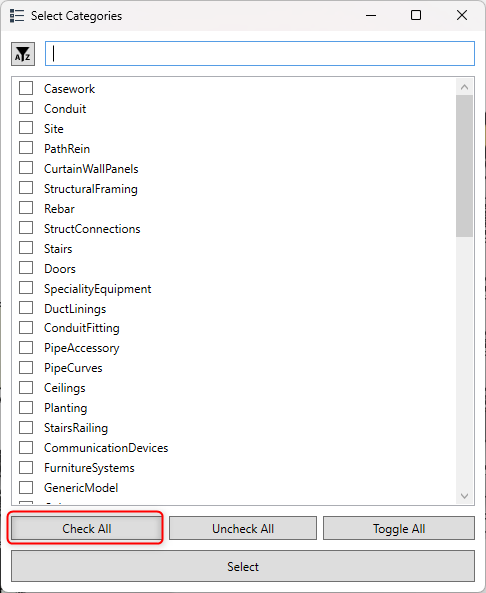
Purpose: This tool selects all elements within specified categories.
How to Use:
tool button from the ToolBox Tab.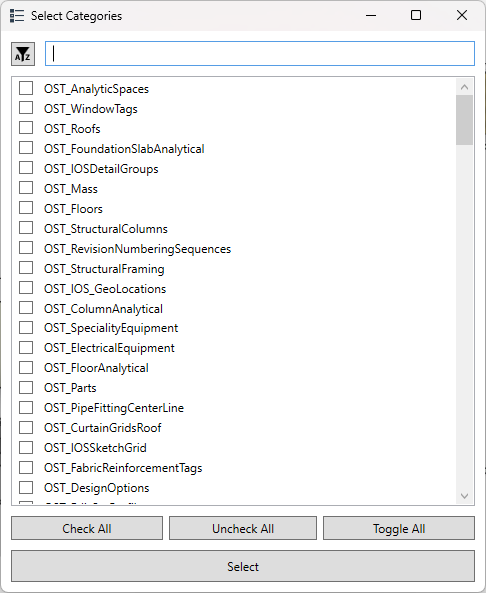 will display their ID, Name, and Category.
Parent Tools:
Reduce Selection by OST Categories
Purpose: This tool selects all elements within specified views.
How to Use:
tool button from the ToolBox Tab.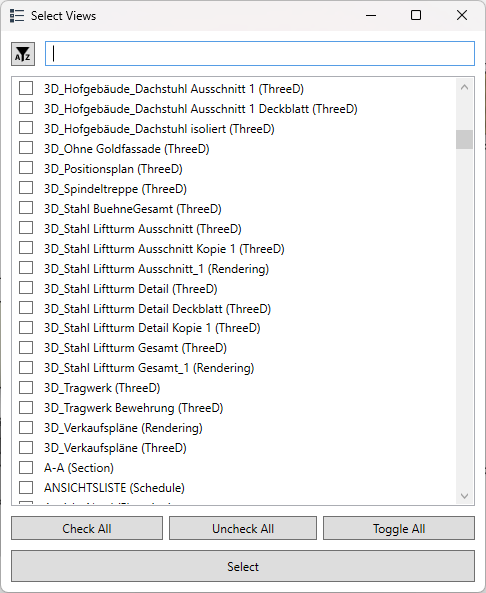 will display their ID, Name, Category, and View name.
Purpose: This tool selects all elements on a specific level within the current or another view.
How to Use:
tool button from the ToolBox Tab.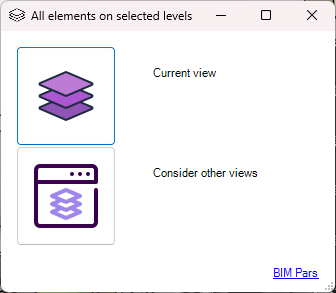
 will display their ID, Name, Level, View, and Category.
Purpose: This tool selects all elements owned by specific users.
How to Use:
tool button from the ToolBox Tab.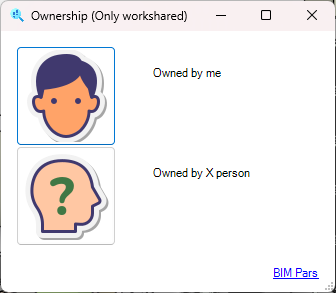 will show ID, Name, Category, and Owner.
Purpose: This tool selects all unbound rooms.
How to Use:
tool button from the ToolBox Tab. will display the ID and Name of all unbound rooms.Purpose: This tool selects all mirrored doors.
How to Use:
tool button from the ToolBox Tab. will display the ID and Name of the Mirrored doors.The tools in this group use Excel files and element IDs to find and select elements, especially when you have IDs but are unsure of their locations.
Purpose: This tool selects elements using IDs from an Excel file.
How to Use:
 tool button from the ToolBox Tab.
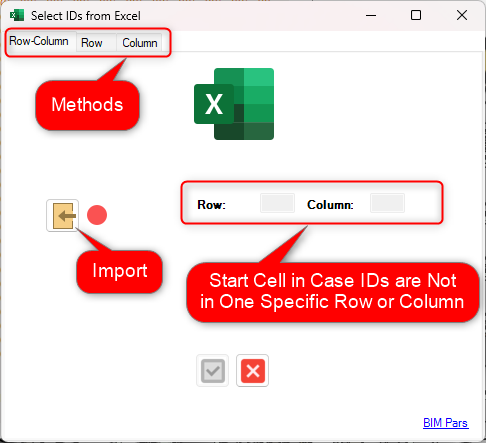 will show the ID, Name, and Category of only the valid elements, excluding the invalid ones.
Parent Tool:
Delete Elements by IDs from Excel
The tools in this group are designed to reduce your current selection based on different criteria. In order to use these tools, you must have some elements already selected; otherwise, the tools will be deactivated. These tools only reduce the selection without making any modifications or transactions.

Purpose: This tool excludes elements from the selection by their ID.
How to Use:
tool button from the ToolBox Tab.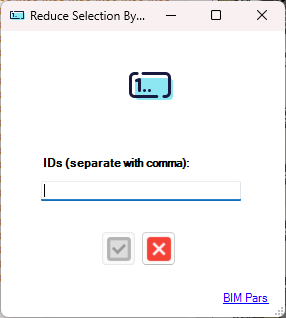 will display the ID, Name, and Category of the remaining elements in your selection.
Parent Tool:
Delete Elements by ID
Purpose: This tool reduces the selection by excluding elements from specific categories.
How to Use:
tool button from the ToolBox Tab.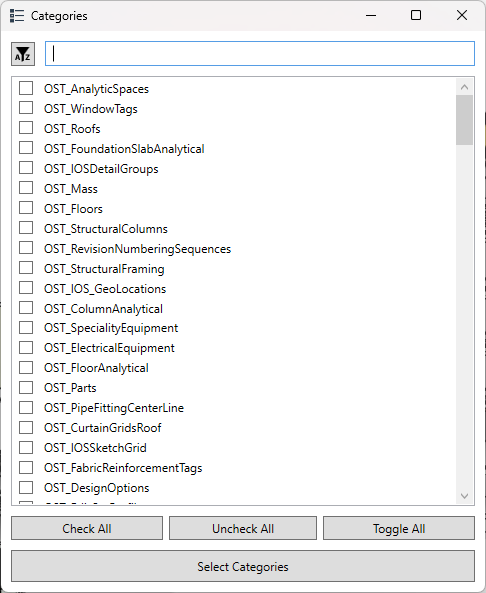 will display the ID, Name, and Category of the remaining elements in your selection.
Parent Tools:
All Elements in Selected Categories
Purpose: This tool reduces the selection by excluding elements with a specific parameter and value.
How to Use:
tool button from the ToolBox Tab.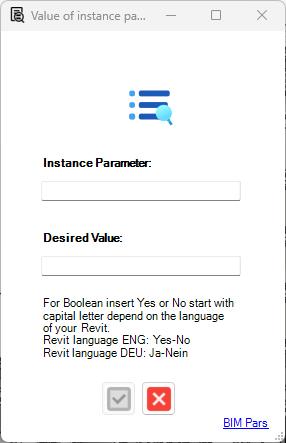 will display the ID, Name, and Category of the remaining elements in your selection..
Note: For boolean parameters, enter Yes or No, depending on your Revit language (e.g., for German, for English).
Parent Tools:
Select by Search for Value of Instance Parameters
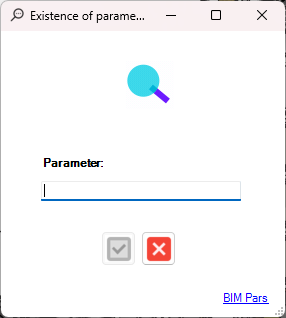
Purpose: This tool reduces the selection based on the existence of a parameter’s value. You have three options for how to reduce the selection:
How to Use:
tool button from the ToolBox Tab.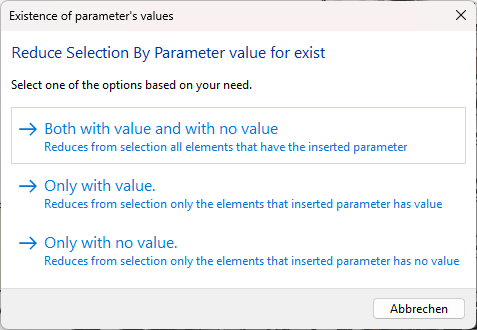
 will display the ID, Name, and Category of the remaining elements in your selection.
Parent Tools:
Search based on Existence of Parameters Value
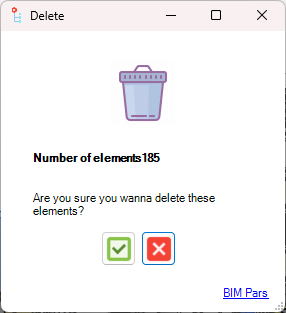
The tools in this group are designed to delete elements in the model using various methods. These tools perform the deletion transaction, and it's important to ensure no elements are selected before starting any of these tools. If elements are selected, you will be notified to deselect them first. Additionally, some elements may be dependent on others, which can prevent their deletion. In such cases, even though the tools will display results in the Report Tab, the deletion will not be executed .

Purpose: This tool deletes elements based on their element ID.
How to Use:
tool button from the ToolBox Tab.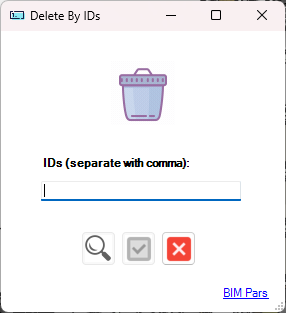
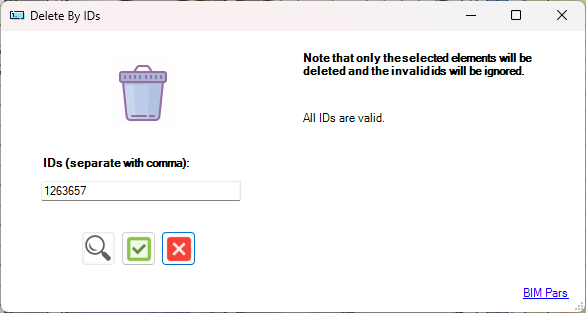 will display the ID and Status of the deleted elements.
Parent Tool:
Reduce Selection by ID
Purpose: This tool deletes elements based on IDs provided in an Excel file.
How to Use:
tool button from the ToolBox Tab.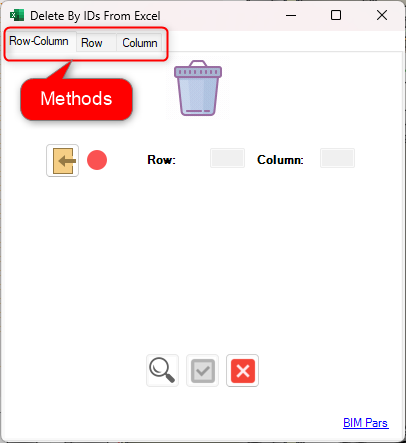
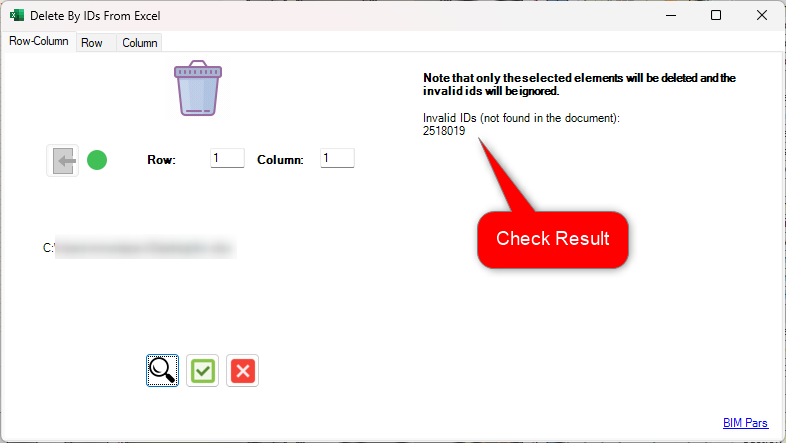 will display the ID and Status of the deleted elements.
Parent Tool:
IDs from Excel
Purpose: This tool deletes elements based on a Type filter that includes characteristics such as view, level, category, family, and type.
How to Use:
tool button from the ToolBox Tab.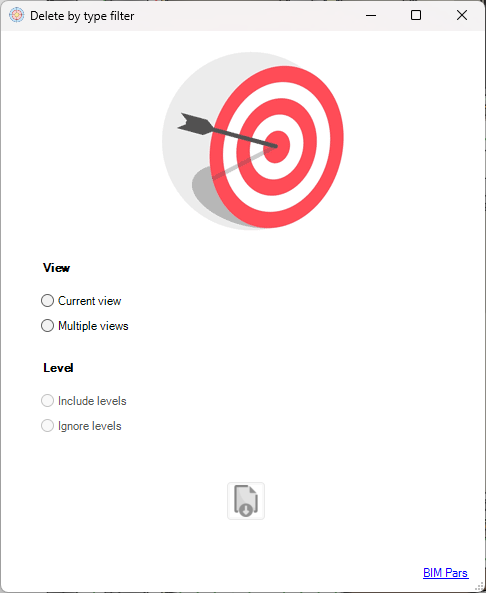
 will display the Element ID and Status of the deleted elements.
Parent Tool:
Type
Purpose: This tool automatically finds and deletes all DirectShape elements in the model.
How to Use:
tool button from the ToolBox Tab.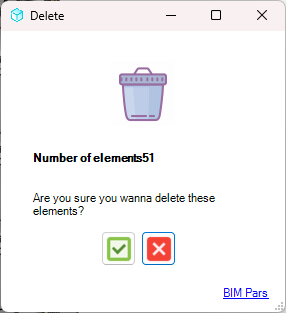 will display the ID and Status of the deleted elements.
Note: This tool can also delete Pins that point to elements, as these use DirectShape elements.
Purpose: This tool deletes all elements from specific categories.
How to Use:
tool button from the ToolBox Tab.
 will display the ID and Status of the deleted elements.
Parent Tools:
All Elements in Selected Categories
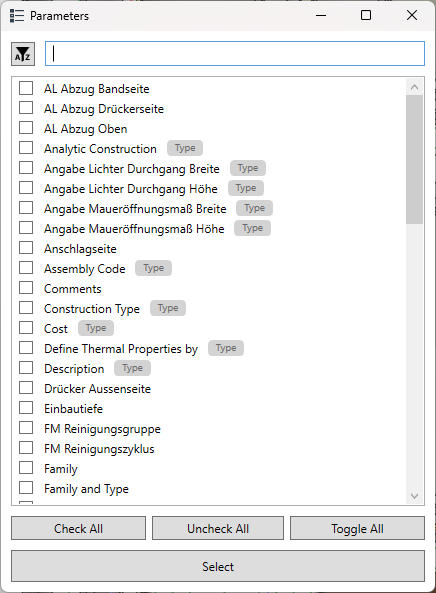
The tools in this group are focused on parameters themselves, rather than the values they hold. These tools are divided into three subgroups: Search, Check, and Delete. The Search and Check tools provide insights into parameter data without modifying the model, while the Delete tools are designed to delete parameters and perform transactions in the model.
The tools in this subgroup focus on searching for and investigating parameter values without making changes to the model. These tools help you find and analyze parameter data based on specific filters and conditions.


Purpose: Filters elements and allows you to investigate the parameters and their values for the filtered elements.
How to Use:
tool button from the ToolBox Tab.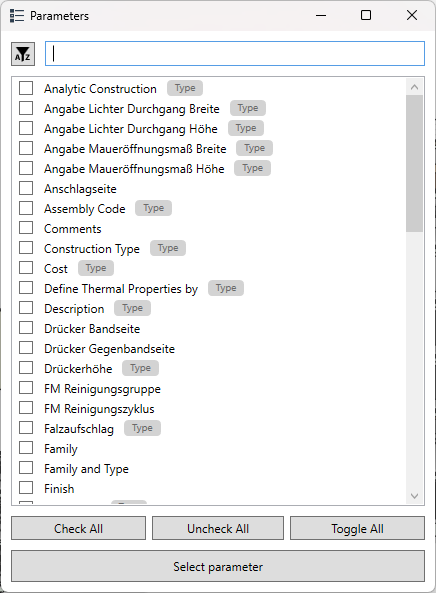 will display the ID, Name, Parameter, and Value of the filtered elements.
Note: If a category or family does not have parameters, you will be notified.
Parent Tool:
Search Value of Parameter for Family Document
Purpose: Similar to the previous tool but specifically for investigating parameters within a . Useful for nested family parameter investigation.
How to Use:
tool button from the ToolBox Tab in a family document..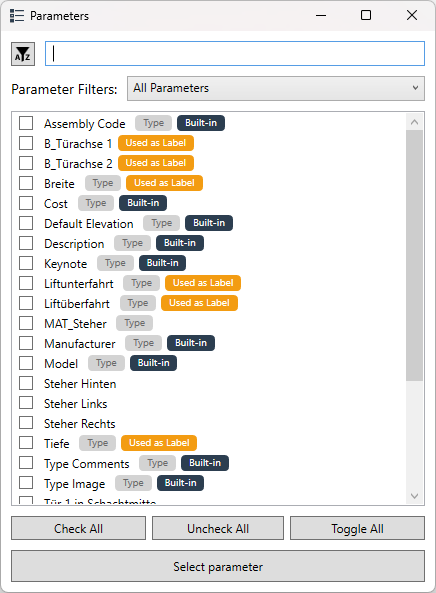
Note: The parameter list includes labels to show if the parameter is Built-in, Type, or Used as Label. If no parameters are available for a selected family or category, you will be notified.
Parent Tool:
Search Value of Parameter by Filter
Purpose: Investigates parameters for a .
How to Use:
tool button from the ToolBox Tab. will display the ID, Name, Parameter, and Value of the selected element.
Parent Tool:
Snipe Parameter Value for Family Document
Purpose: Investigates parameters of a in a . Useful for .
How to Use:
tool button from the ToolBox Tab.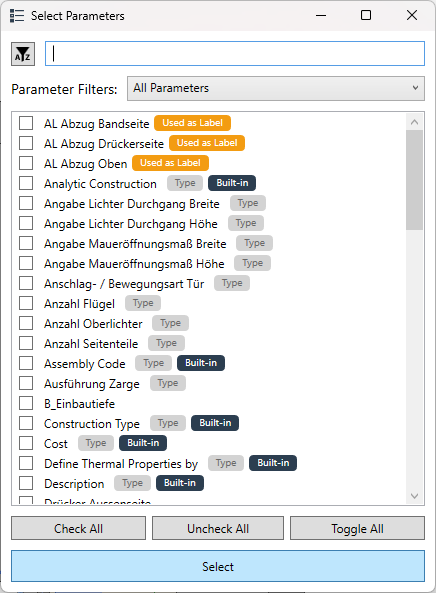 will display the ID, Name, Parameter, and Value.
Note: The parameter list includes labels showing whether the parameter is Built-in, Type, or Used as Label.
Parent Tool:
Snipe Parameter Value
Purpose: Obtains the parameter dictionary of a , including detailed information about the parameter type, name, storage type, and value.
How to Use:
tool button from the ToolBox Tab. will display the Type of parameter (Instance or Type), Parameter Name, Storage Type, whether the parameter has a value, and the value of each parameter.The tools in this subgroup perform checks based on parameter values. These checks are designed to help you analyze and organize parameter data. The results of these tools will be displayed in a Check Result format.
Purpose: Checks if specific parameters exist for elements, with three logic options:
How to Use:
tool button from the ToolBox Tab.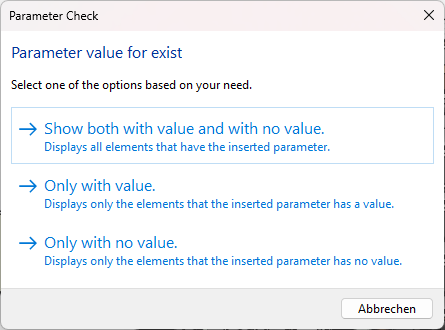

 will display the ID, Name, Category, Target Parameter, Storage Type, and Value for the checked elements.
Parent Tools:
Search based on Existence of Parameters Value
Purpose: Checks if specific parameters are assigned to specific categories using an Excel file.
How to Use:
 tool button from the ToolBox Tab.
 .
.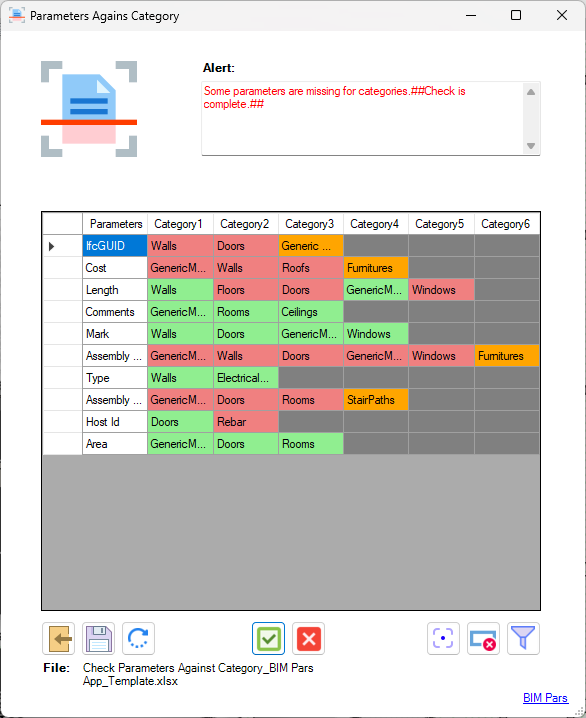 , showing the Missing Parameters for each Category.
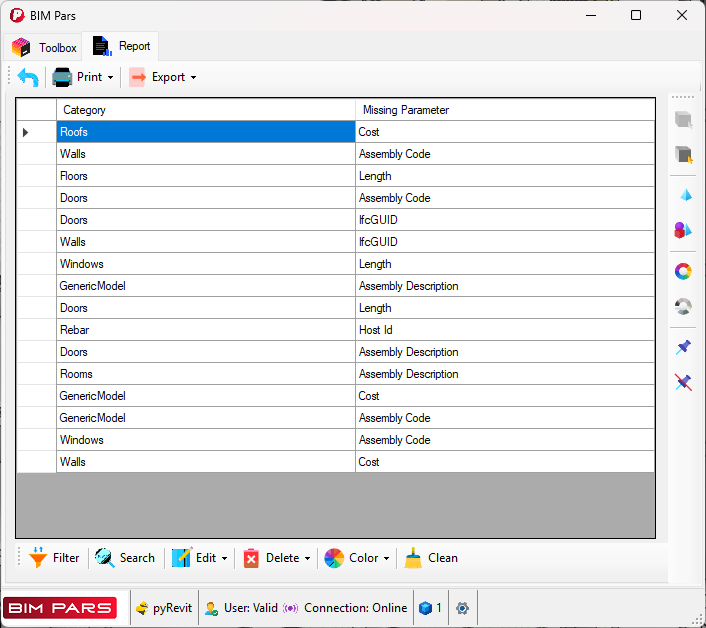
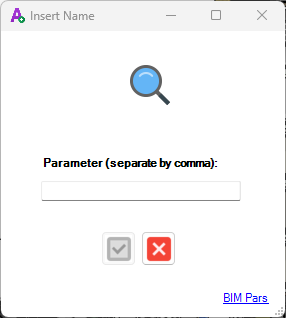
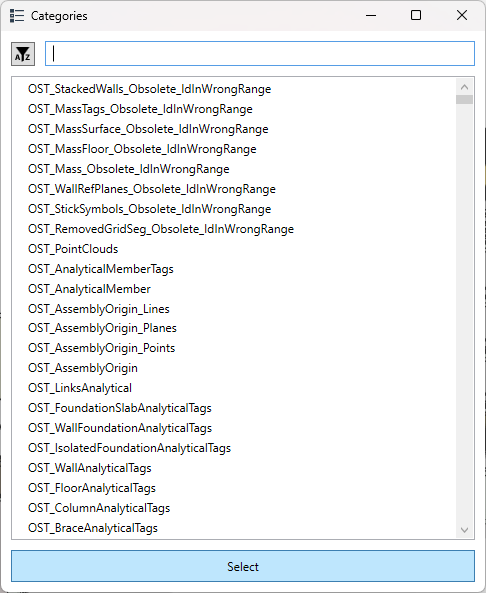
The tools in this group are designed to completely delete a parameter from the model. These tools provide different methods to identify and delete parameters, ensuring that once deleted, the parameter is removed from all instances in the model.
Purpose: This tool allows you to delete a parameter entirely from the model using three different methods.
How to Use:
 button in the ToolBox Tab.
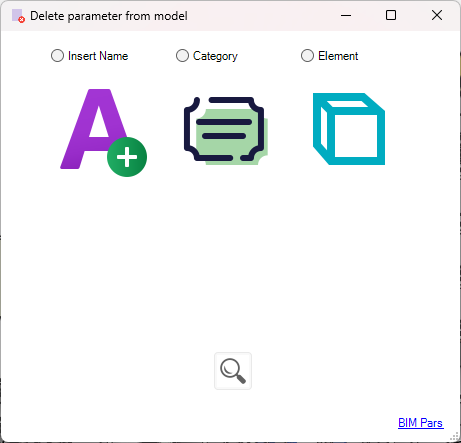
 .
.Notes:
The tools in this group focus on modifying and managing the value of a parameter. The tools are divided into five subgroups: Search, Comparison Check, Setting Value, Edit Value, and Delete Value. While the tools in the Search and Comparison Check subgroups only display information and do not alter the model, the other subgroups actively perform transactions that modify the values of parameters.


The tools in this subgroup are used for searching specific values of parameters without making any changes to the model.
Purpose: This tool allows you to find elements that have a specific value for a given instance parameter.
How to Use:
tool button in the ToolBox Tab.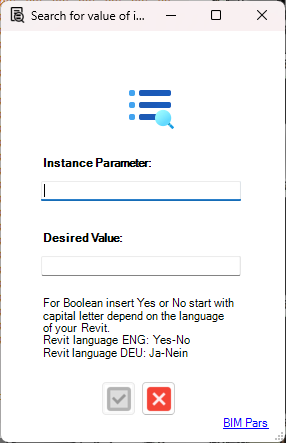 .
.Note: For boolean parameters, enter Yes or No, depending on your Revit language (e.g., for German, for English).
Parent Tools:
Select by Search for Value of Instance Parameters
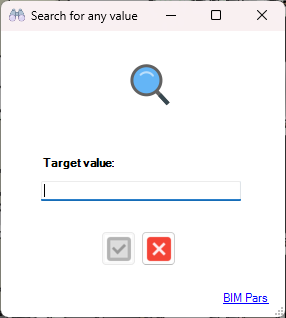
Purpose: This tool finds elements that have specific values for parameters within the selected elements.
How to Use:
 button in the ToolBox Tab.
 .
.The tools in this subgroup perform comparison checks, comparing parameters across elements or views to check for matching values.
Purpose: Compares two items (views or elements) based on their parameters to check if their values are identical.
How to Use:
 tool button in the ToolBox Tab.
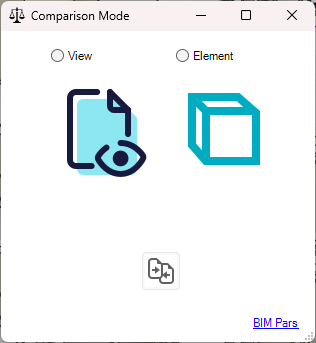 :
:Note: If there are unique parameters (i.e., parameters that are not common to both items), they will be identified and displayed as Unique parameters.
Purpose: Compares multiple elements based on the values of their parameters to check if they are exactly the same.
How to Use:
 tool button in the ToolBox Tab. will show the following results for each parameter:
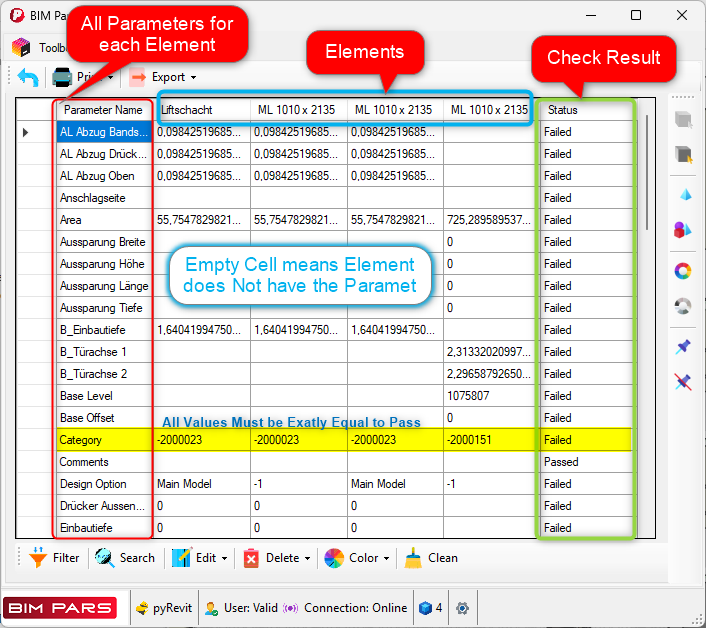
The tools in this group are designed to set values for parameters in the model. These tools allow you to assign or change parameter values for multiple selected elements, copy values between parameters, and import a list of values from an external file.


Purpose: This tool allows you to set the same value for a parameter across all selected elements.
How to Use:
tool button in the ToolBox Tab.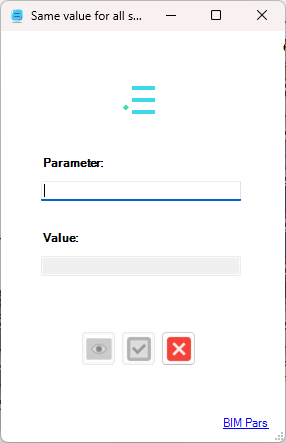
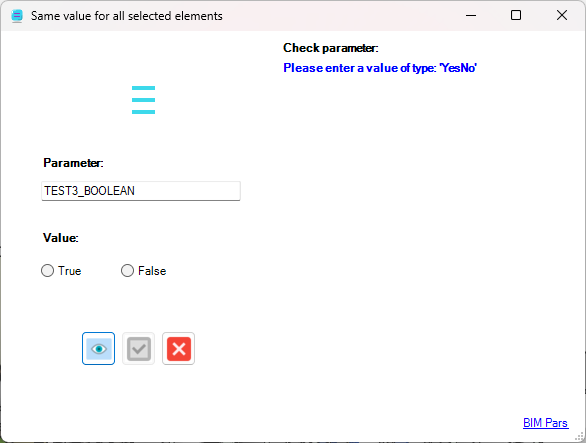 will display:
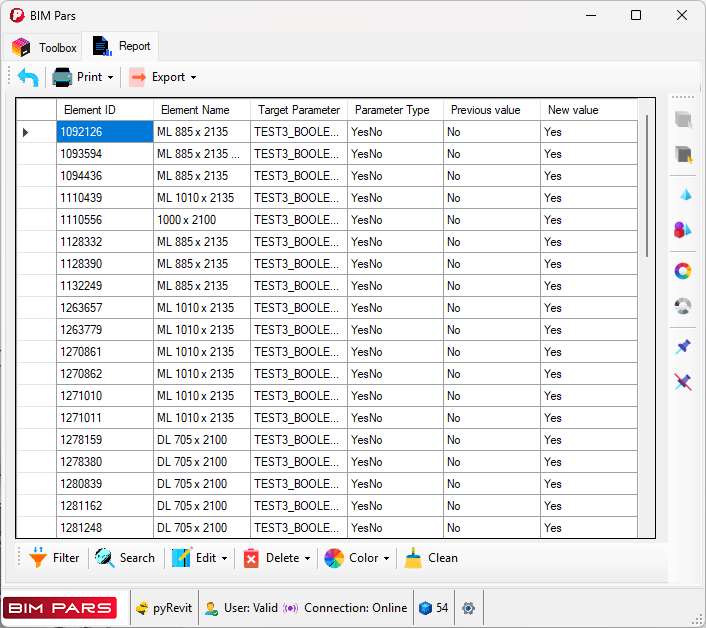
Notes:
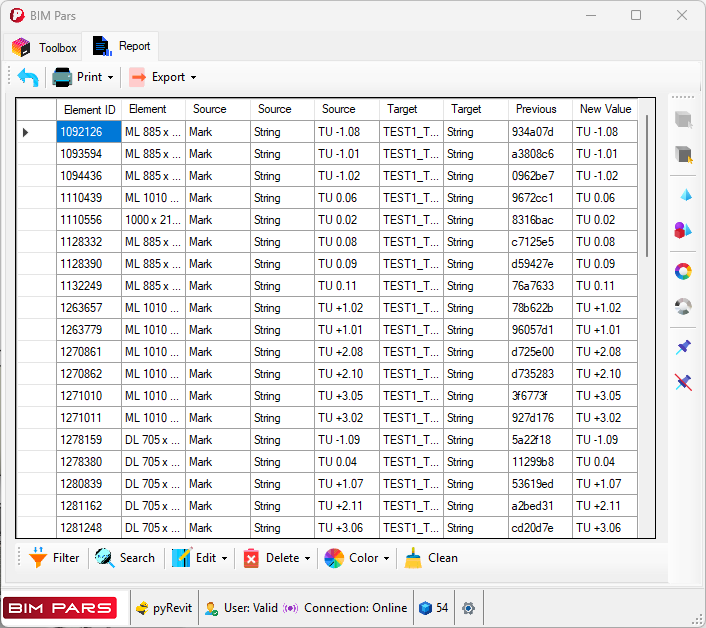
Purpose: This tool allows you to copy the value of one parameter and set it as the value for another parameter on the same element.
How to Use:
button in the ToolBox Tab.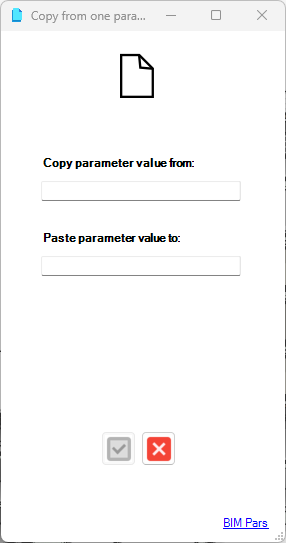
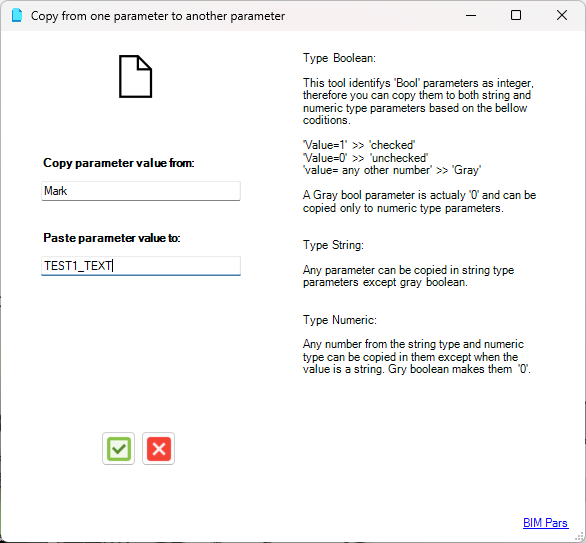 will display:
Notes:
Purpose: This tool allows you to create a list of repetitive values in an Excel file and use that list to set the value for selected elements.
How to Use:
tool button in the ToolBox Tab.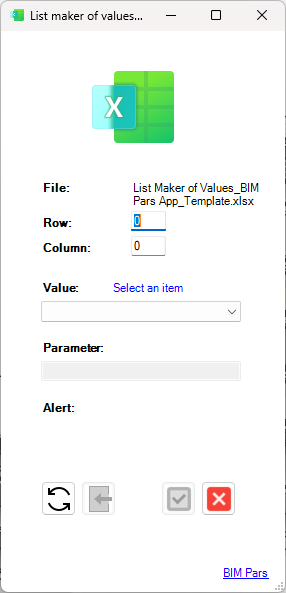
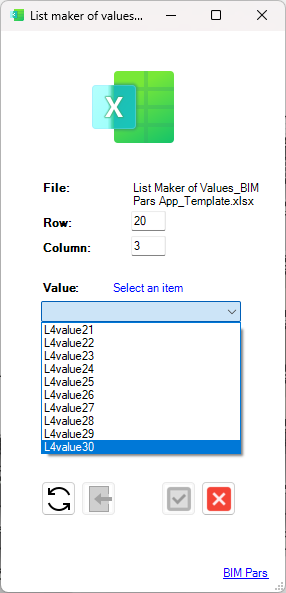
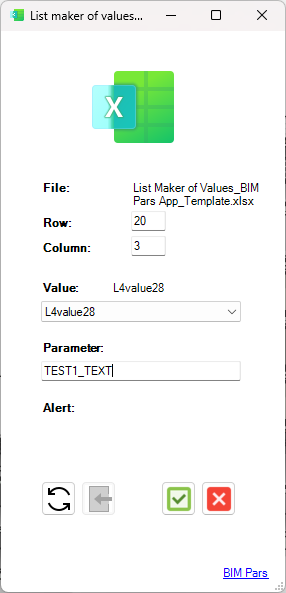 will display:
Note: The imported list stays in the memory of the tool until you import a new list or click the Refresh button, at which point the list will be cleared.
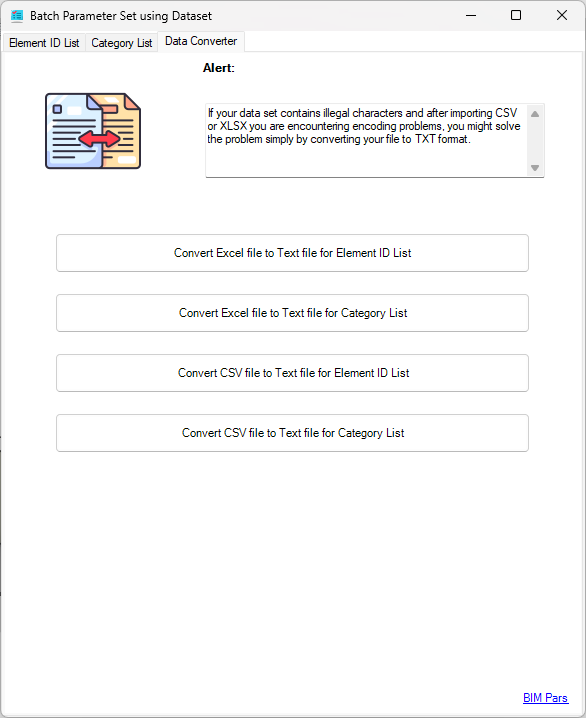
Purpose: This tool allows you to set values for parameters in bulk based on datasets in Excel, CSV, or text files, either by element or category.
How to Use:
tool button in the ToolBox Tab. to modify it.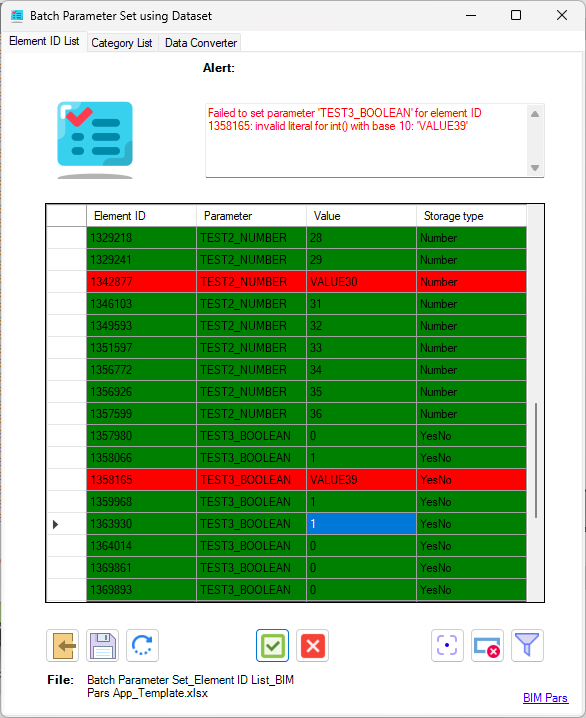 tool button in the ToolBox Tab. to modify it.
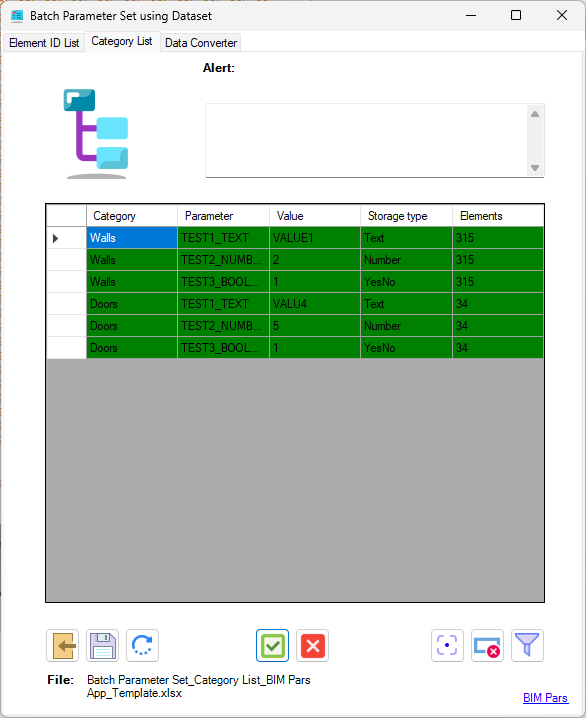
 .
.
Notes:
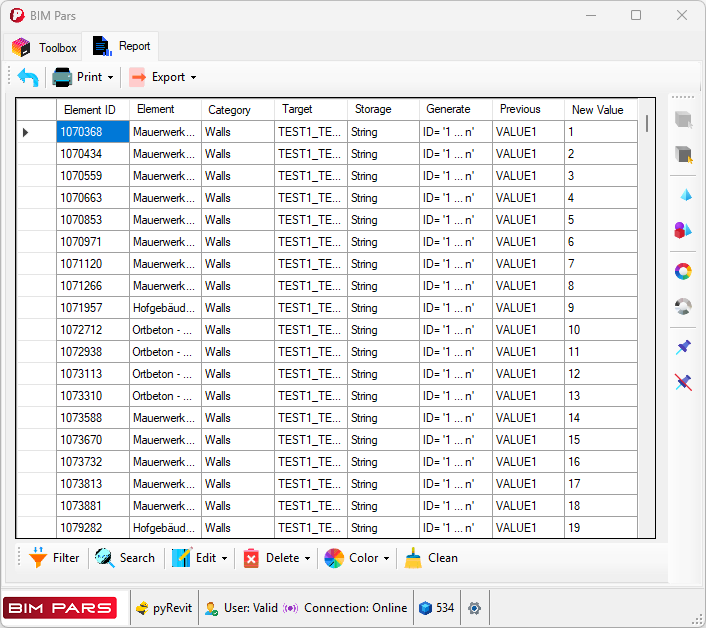
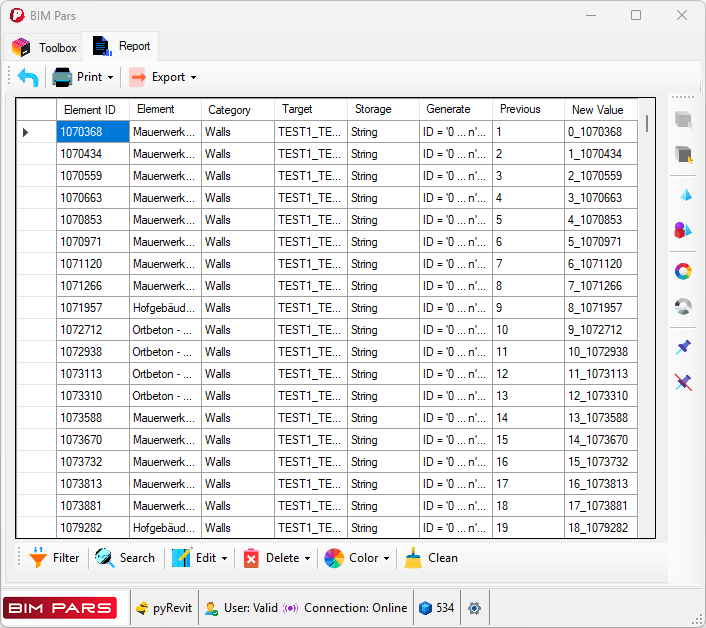
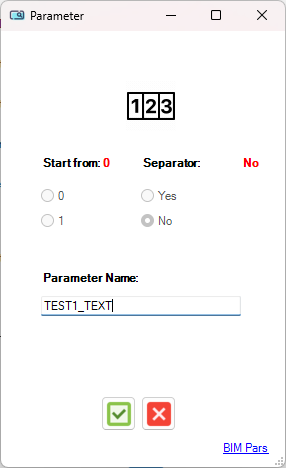
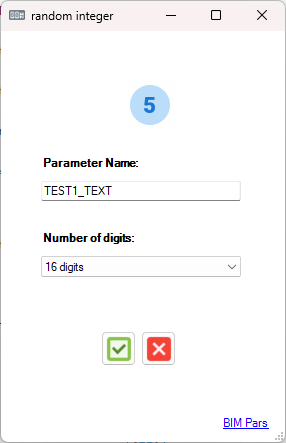
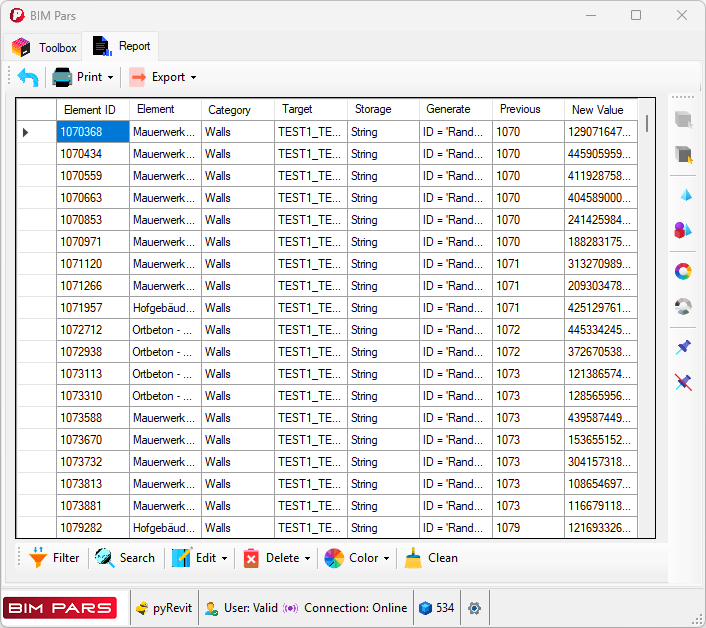
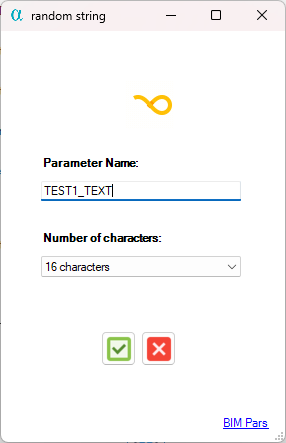
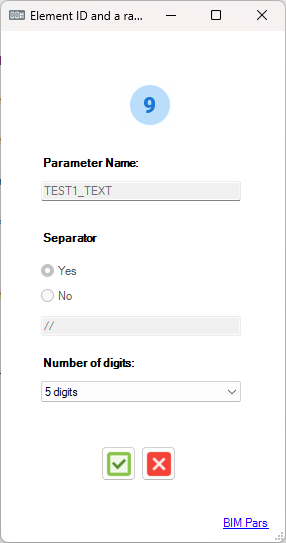
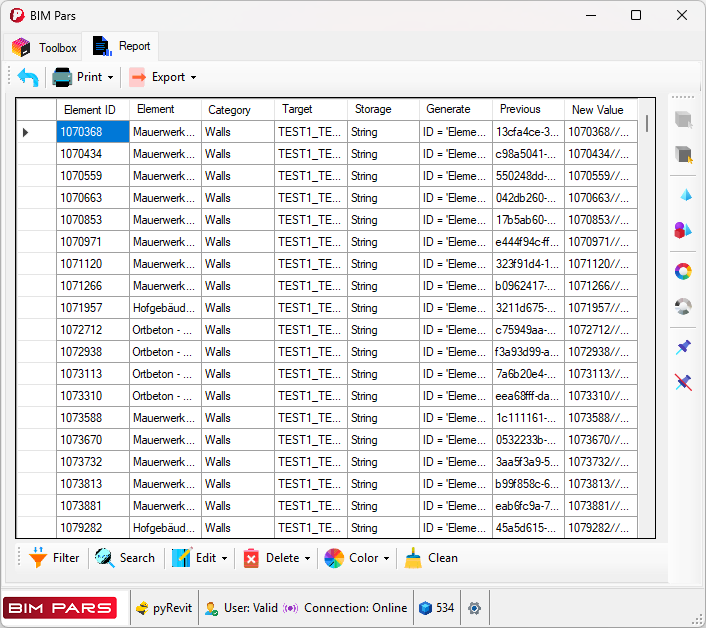
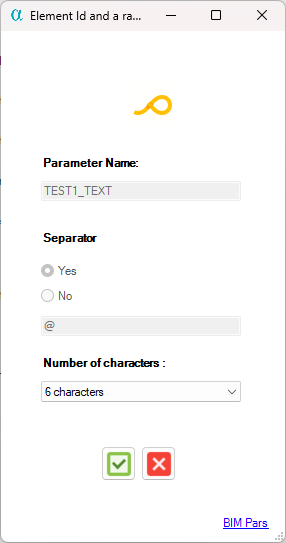
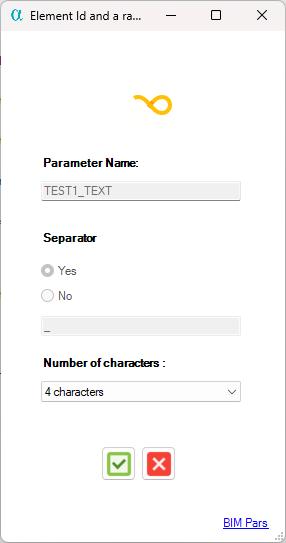
Purpose: This tool generates unique IDs using different methods and then sets these generated IDs as values for a specific parameter of selected elements.
How to Use:
tool button in the ToolBox Tab.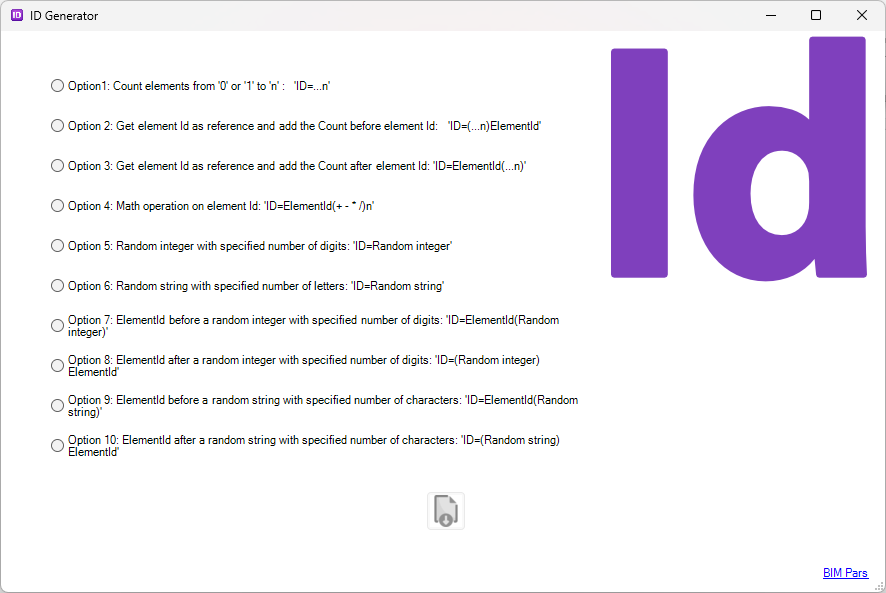
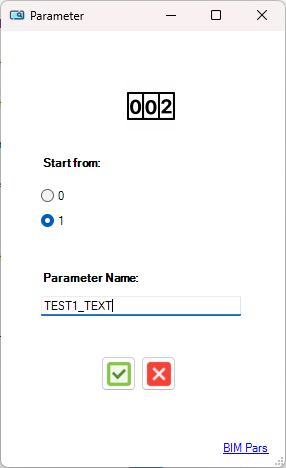 will display the following details:
Example:
 will display the following details:
Example:
 will display the following details:
Example:

 will display the following details:
Example:
 will display the following details:
Example:
 will display the following details:
Example:
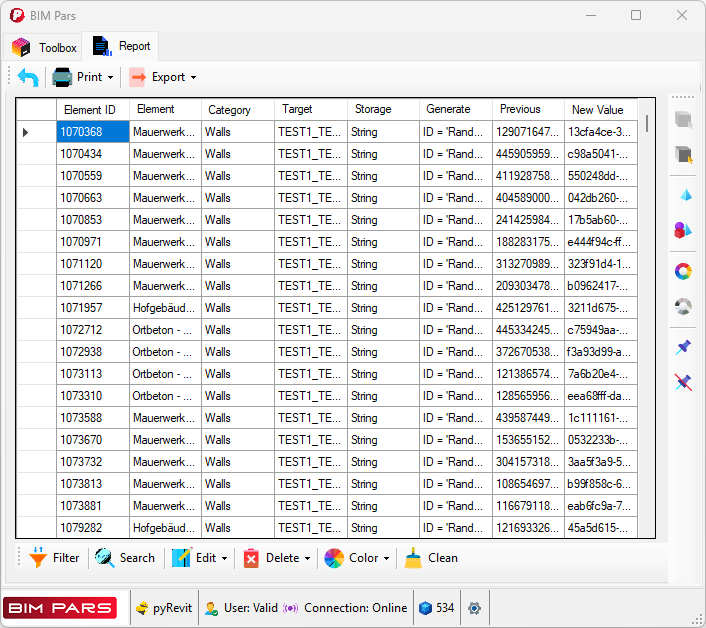
Note: The random string can include numbers or be entirely numeric in some cases.
 will display the following details:
Example:
 will display the following details:
Example:
 will display the following details:
Example:

Note: The random string can include numbers or be entirely numeric in some cases.
 will display the following details:
Example:

Note: The random string can include numbers or be entirely numeric in some cases.
.Notes:
will display the results after each operation, including the unique ID generated.The tools in this group are designed for editing the values of parameters. In order to use the tools in this group, you need to have some elements selected; otherwise, the buttons for the tools will be inactive.
This tool allows you to edit the value of parameters. You will have 4 options to edit the value of a specific parameter for the selected elements.
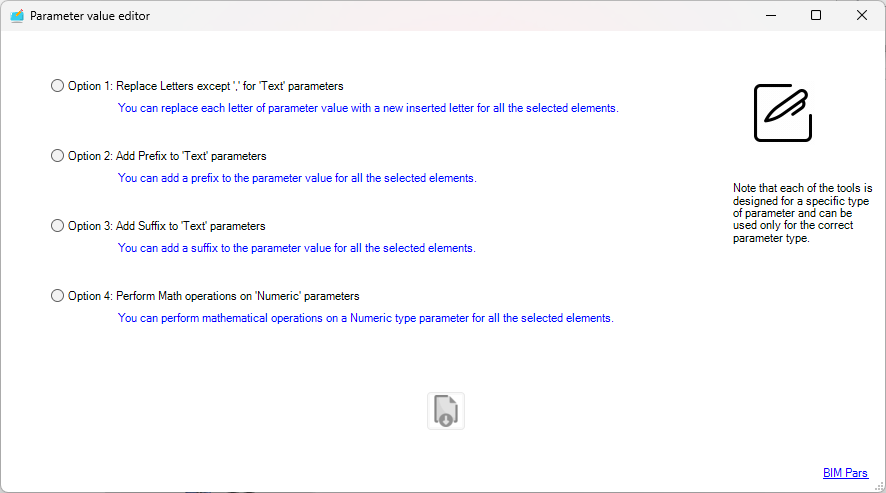
This option allows you to replace any character in the value with another character except comma. If you wish to replace a character other than a comma, use the Parameter Value Editor for Special Characters tool.
tool.
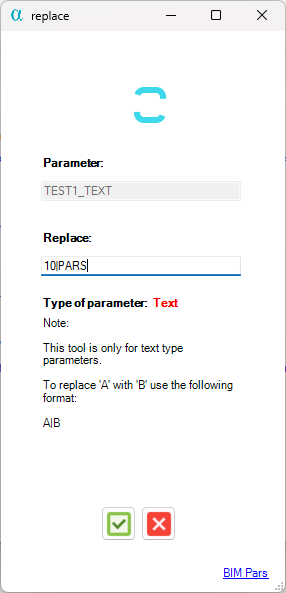 data grid, showing the following columns: ID, Name, Target Parameter, Storage Type of Target Parameter, Previous Value, and New Value.
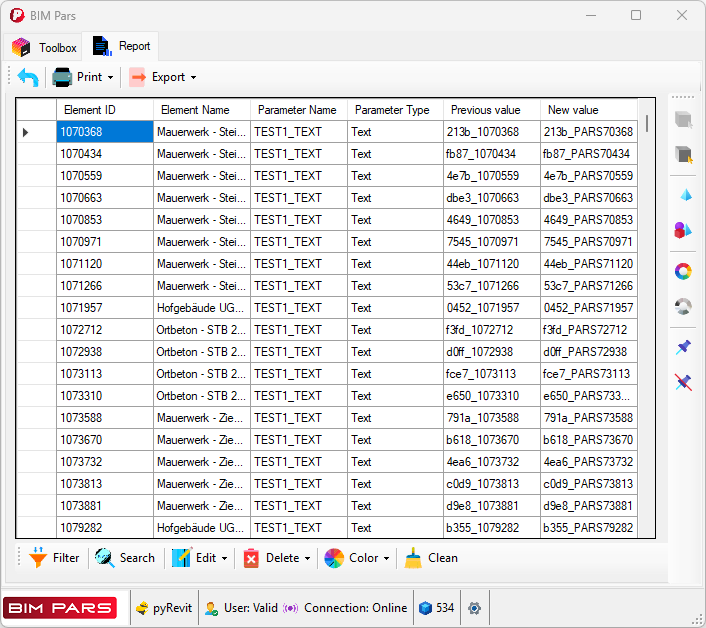
Note: This option is only for parameters with a storage type.
This option allows you to add a prefix to the value of a specific parameter for all selected elements.
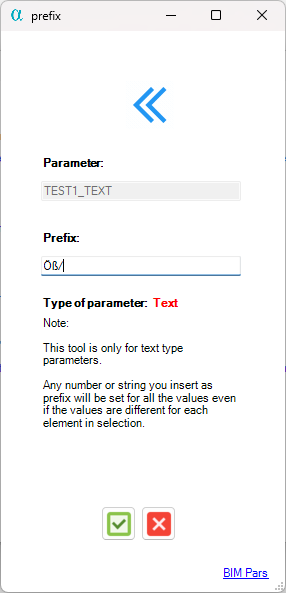 data grid, showing the following columns: ID, Name, Target Parameter, Storage Type of Target Parameter, Previous Value, and New Value.
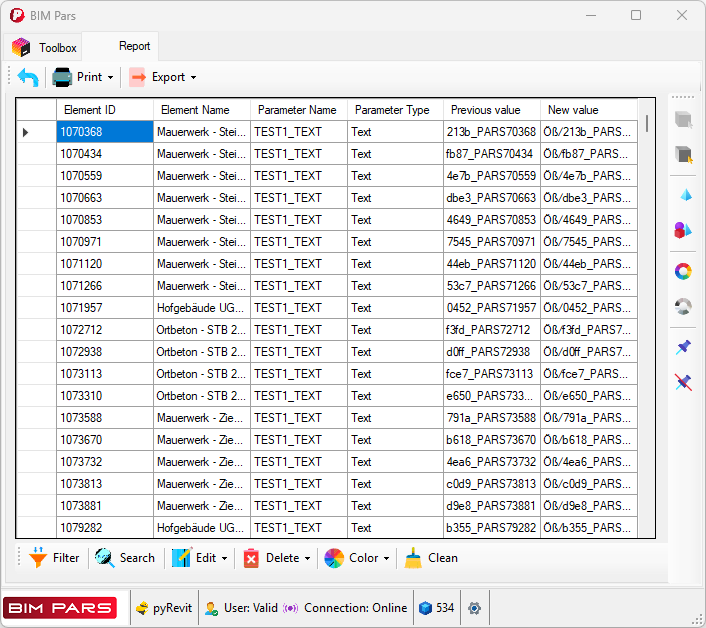
Note: This option is only for parameters with a storage type.
This option allows you to add a suffix to the value of a specific parameter for all selected elements.
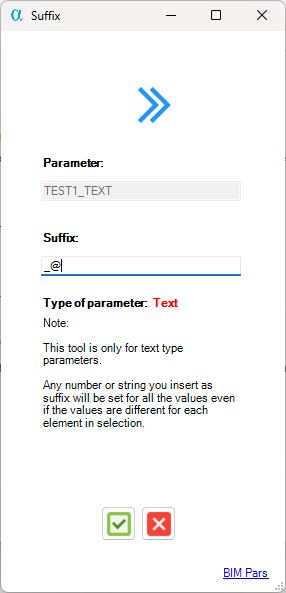 data grid, showing the following columns: ID, Name, Target Parameter, Storage Type of Target Parameter, Previous Value, and New Value.
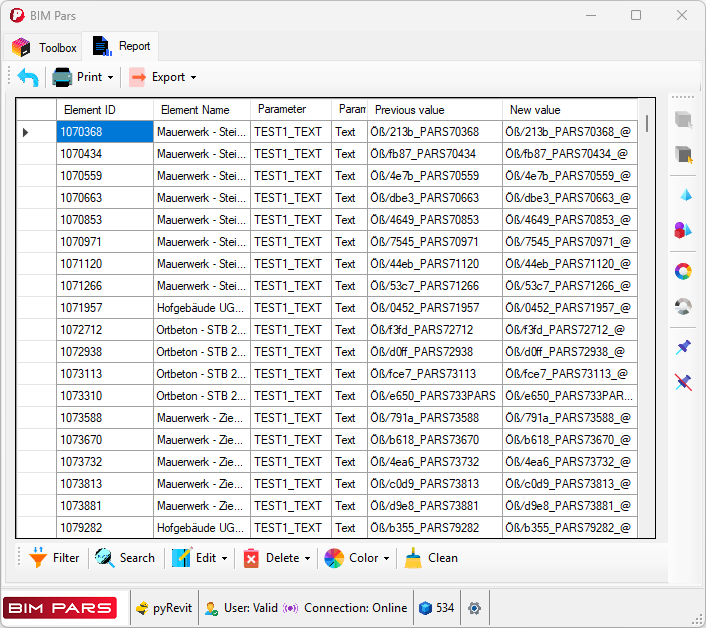
Note: This option is only for parameters with a storage type.
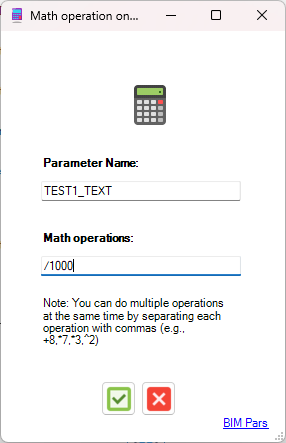
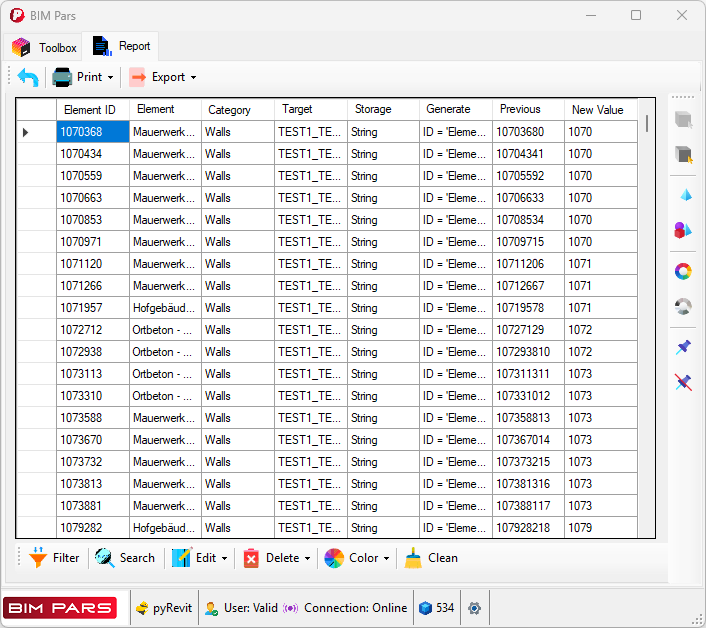
This option allows you to perform a math operation on the value of numeric parameters.
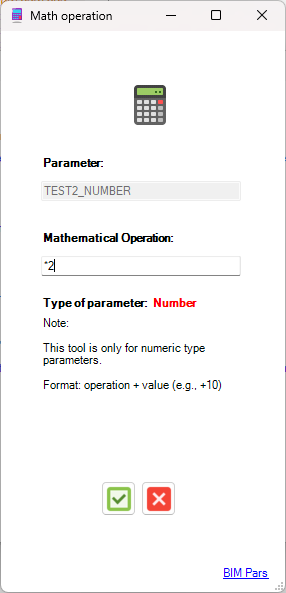 data grid, showing the following columns: ID, Name, Target Parameter, Applied Math Operation, Previous Value, and New Value.
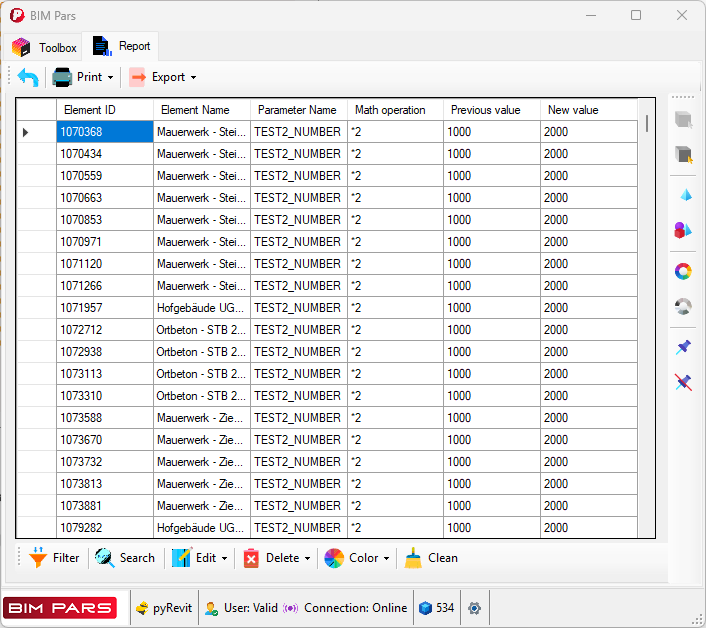
Note: This option is only for parameters with a storage type.
, click on the Parameter Value Editor tool button..
This tool is designed to replace predefined characters with new characters in the value of a specific parameter for all selected elements. You have two options in this tool:
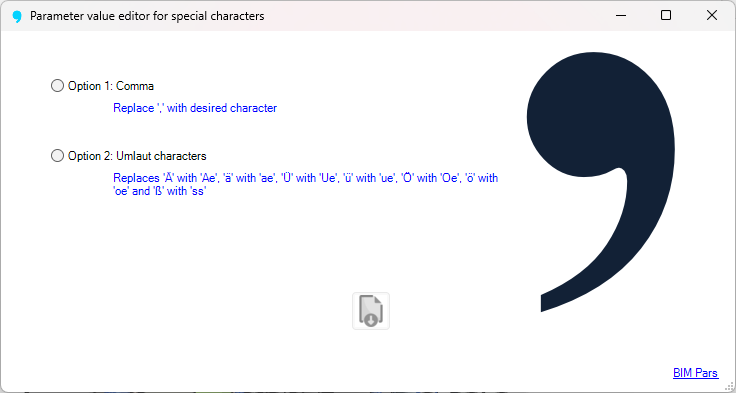
This option replaces commas in the values of parameters with your desired character.
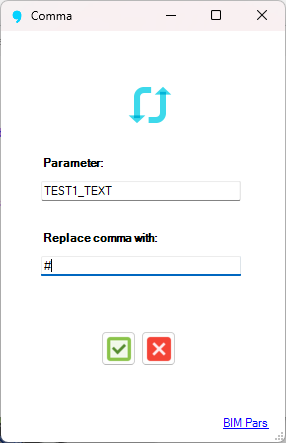 data grid, showing the following columns: ID, Name, Target Parameter, Previous Value, and New Value.
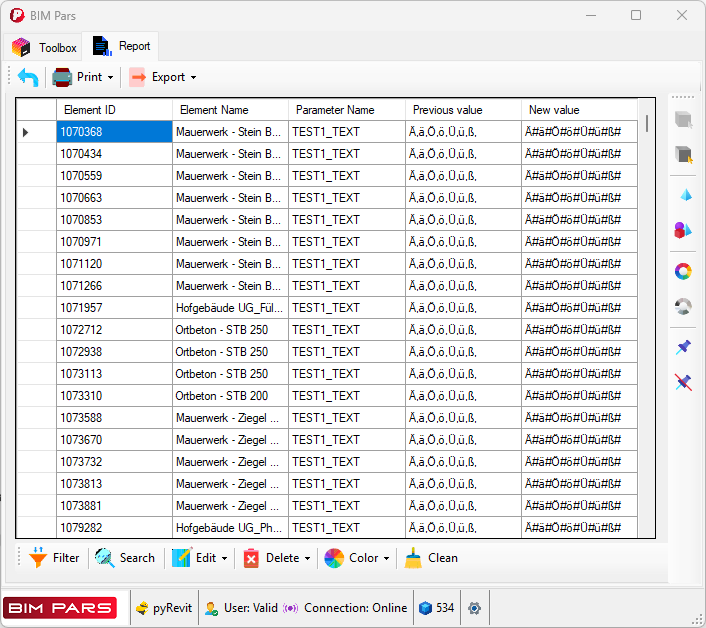
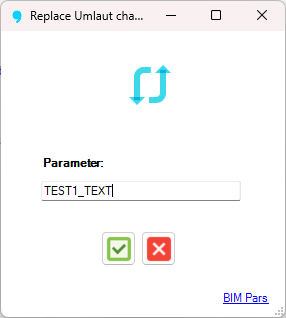
This option automatically replaces German umlaut characters in the value of parameters with standard alphabet letters:
 data grid, showing the following columns: ID, Name, Target Parameter, Previous Value, and New Value.
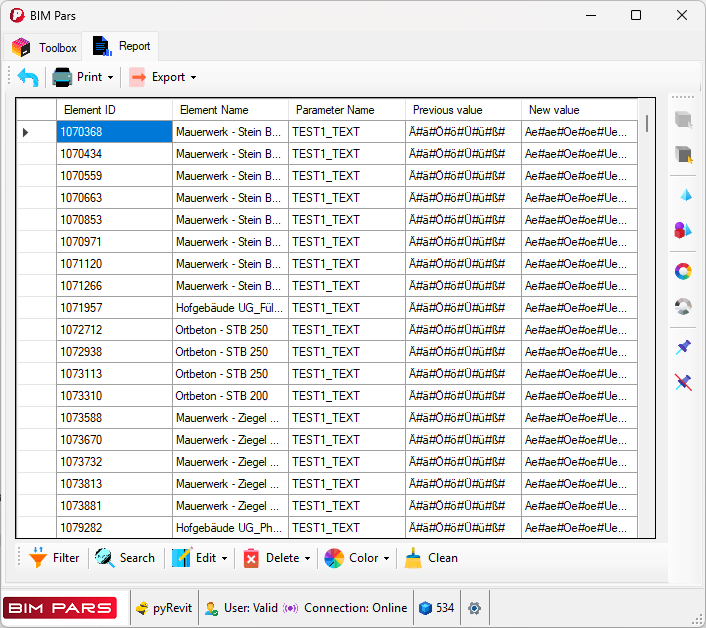 , click on the Parameter Value Editor for Special Characters tool button..
The tools in this group either delete the value of a parameter or remove characters inside the value of parameters. All these tools require a selection, so ensure you have elements selected before using these tools.


This tool deletes the value of a specific parameter for all selected elements.
, click on the Value of Parameter for Selected Elements tool button. data grid:
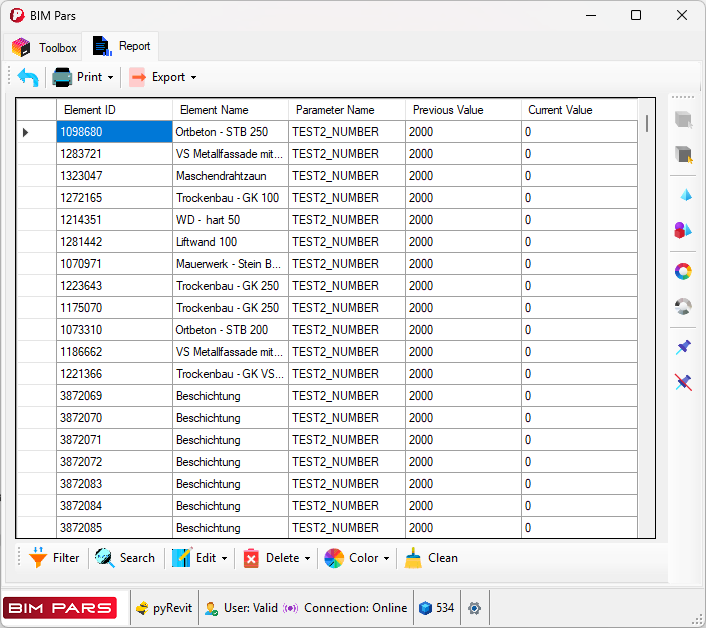
This tool deletes specific characters from the value of a parameter for all selected elements.
, click on the Desired Character in Value of Parameter for Selected Elements tool button.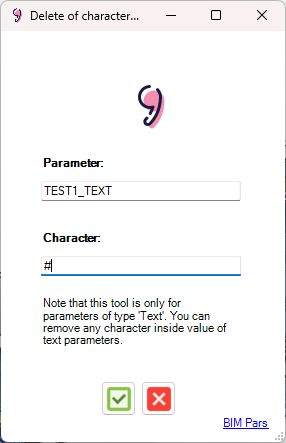 data grid with the following columns:
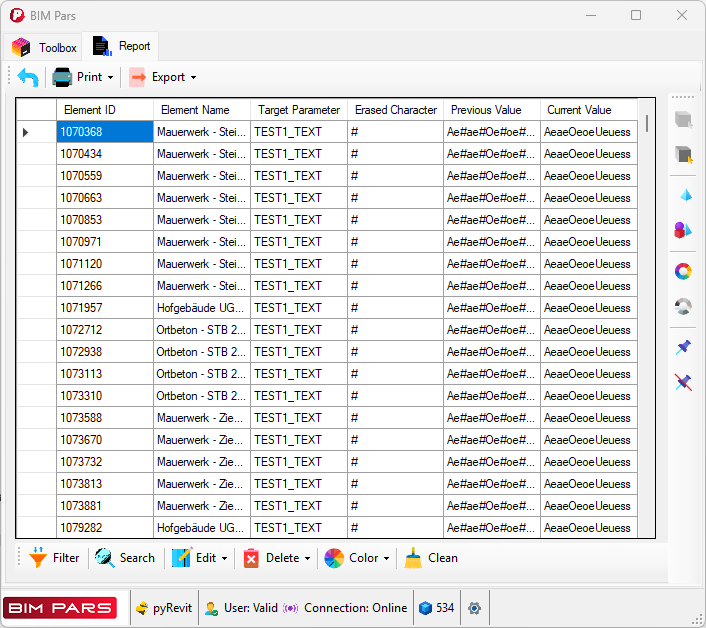
Note: This tool is only for parameters with a storage type.
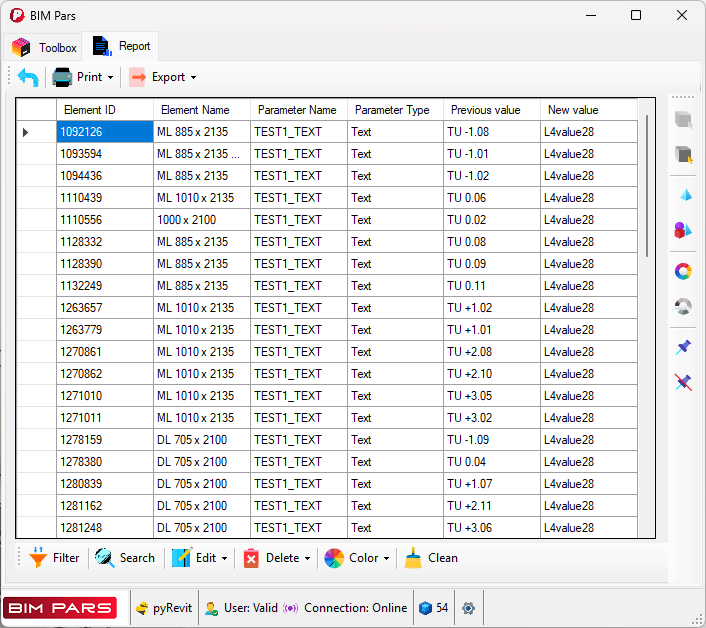
The Report Tab contains a data grid that displays the results of any action or tool used. This tab is temporary and is opened each time a user utilizes a tool. The data grid in the Report Tab presents the information related to the executed action.
: :While the Report tab is open, the Toolbox tab is deactivated, and none of its tools can be used.The top tool strip contains a Back Button that closes the Report Tab. It's important to note that once the Report Tab is closed, it cannot be restored. Therefore, if you need the report later, ensure you export or print it before closing the tab. Also, closing the Report Tab has no effect on the action that was performed; the report simply reflects the outcome of that action.
The Report Tab displays data based on the results of the tool or action performed. The information is automatically organized in a data grid for easier recognition and processing.
To help you manage and process the data in the Report Tab more efficiently, the tool strip includes several options:
These tools help ensure that the report is structured and presented in a way that suits your needs.
To filter data in the data grid, click on the Filter button from the data grid's toolstrip in the Report Tab. In the opened window:
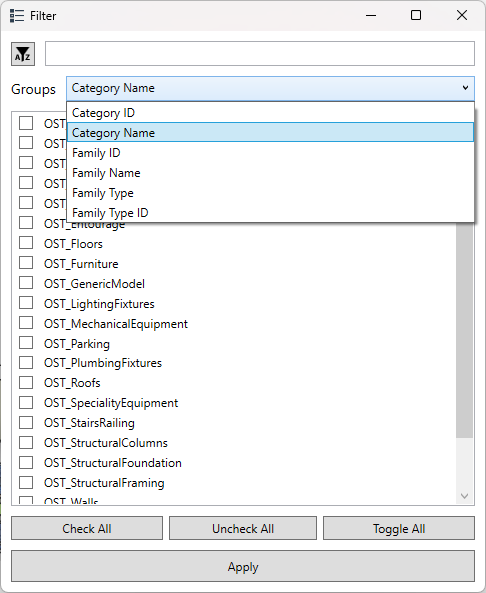
The filter will then be applied to the data grid. It's important to note that the data not matching your filter will be hidden, but not deleted. If you print or export the data, the hidden data will still be included. To remove the hidden data from the report, use the Delete Hidden Cells option from the Delete dropdown
 in the data grid's toolstrip in the Report Tab.
.
If you want to restore the hidden data, go back to the Filter window and click for any column that has been filtered. This action will only work if you haven’t deleted the hidden data.
To search for a specific value in the data grid, click the Search button from the data grid’s toolstrip in the Report Tab. In the opened window:
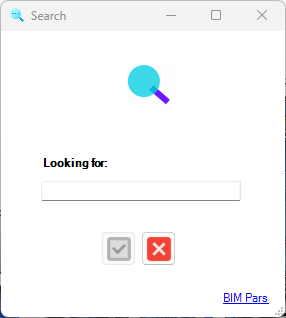
Once the search is complete, you will be notified of how many cells were found, and the matching cells will be selected in the data grid.
There are five options to edit the data grid:
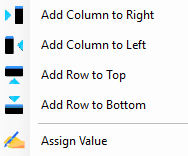
 from the Edit dropdown
 in the data grid’s toolstrip.
 .
. or Add Row to Bottom
 from the Edit dropdown.
 from the Edit dropdown in the data grid’s toolstrip.
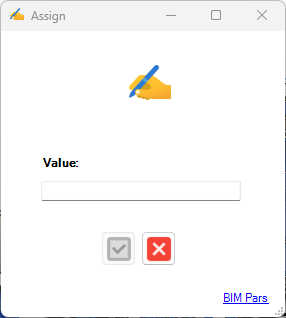 option for editable cells in non-editable columns. In such cases, you must manually assign the value to each cell.
Deletion in the data grid applies to both editable and non-editable rows and cells. There are three options for deletion:
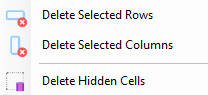 in the data grid's toolstrip in the Report Tab in the data grid’s toolstrip, click Delete Selected Rows. in the data grid's toolstrip in the Report Tab, click Delete Selected Columns
 . option. in the data grid's toolstrip in the Report Tab, click Delete Hidden Cells and confirm. The hidden cells will be deleted, and only visible data will be exported or printed.
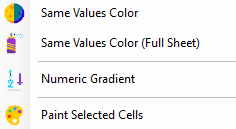
When analyzing data in a data grid, especially with large datasets, visually highlighting cells with specific characteristics can be helpful. BIM Pars app![]() provides four color assignment options for data grid cells:
provides four color assignment options for data grid cells:
 from the Color dropdown
 in the data grid’s toolstrip.
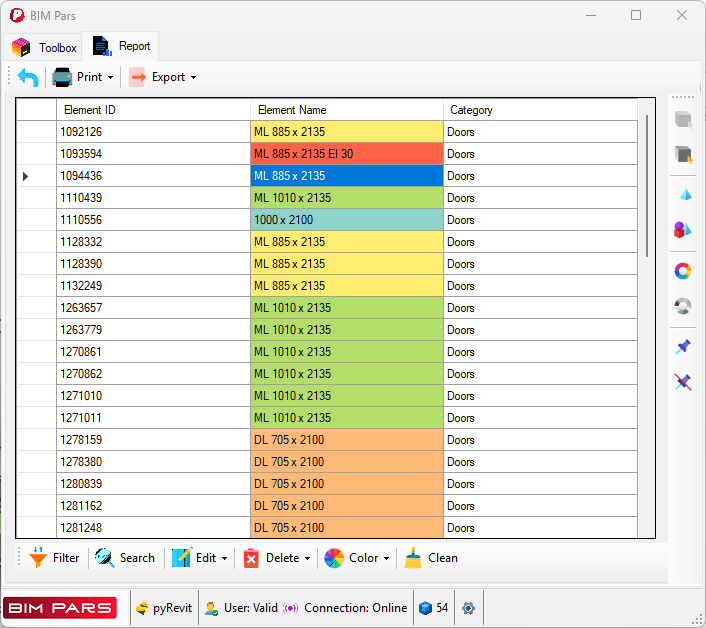
 from the Color dropdown.
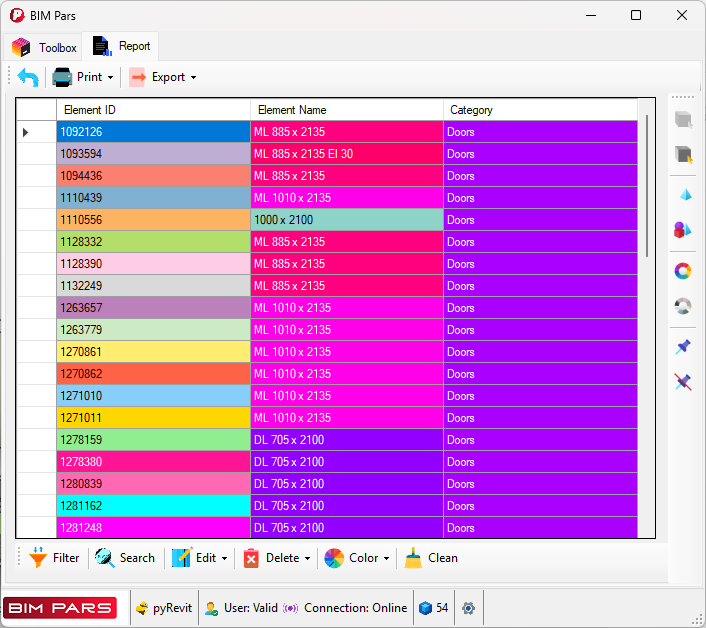
 from the Color dropdown.
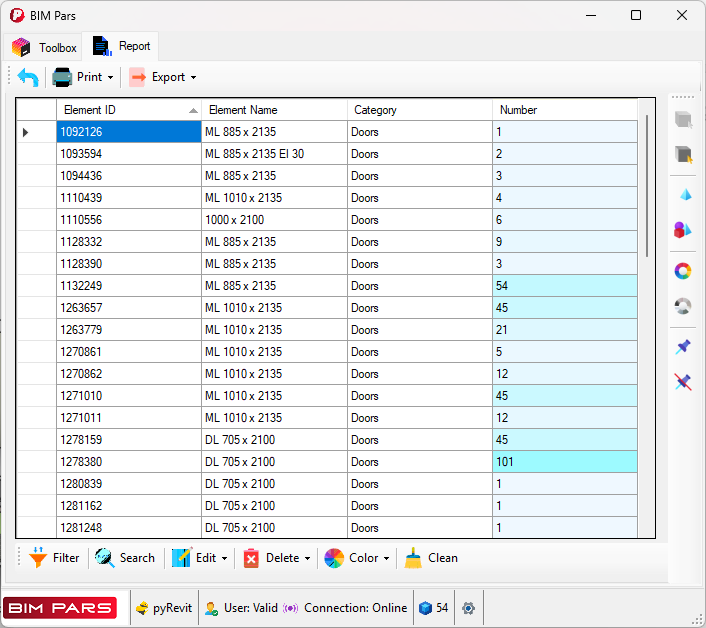
 from the Color dropdown.
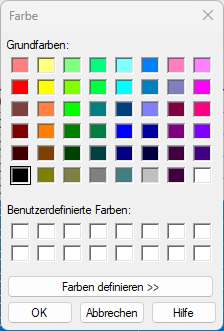
Note: Colors assigned in the data grid can be exported as HTML or XLSX files. However, when exporting to CSV or printing, only the data (not the colors) will be included.
This option resets all colors in the data grid. It will restore the default color (white) for all cells. To clear all colors:
 in the data grid’s toolstrip.
You can print the data grid to create a report.
The generated report can be saved as PDF or HTML.
from the top toolstrip in the Report Tab, and then select pyRevit. , opened in a browser
 , printed or saved as PDF
 , saved as HTML
 , or , copied to the clipboard
 .
.
Note: If the data grid contains colors, these will not appear in the pyRevit output window print.
Not available in BIM Pars V1.0
There are three options for exporting the data in the data grid: HTML, XLSX , and CSV.
Steps:
from the top toolstrip and select HTML.
Steps:
from the top toolstrip and select XLSX.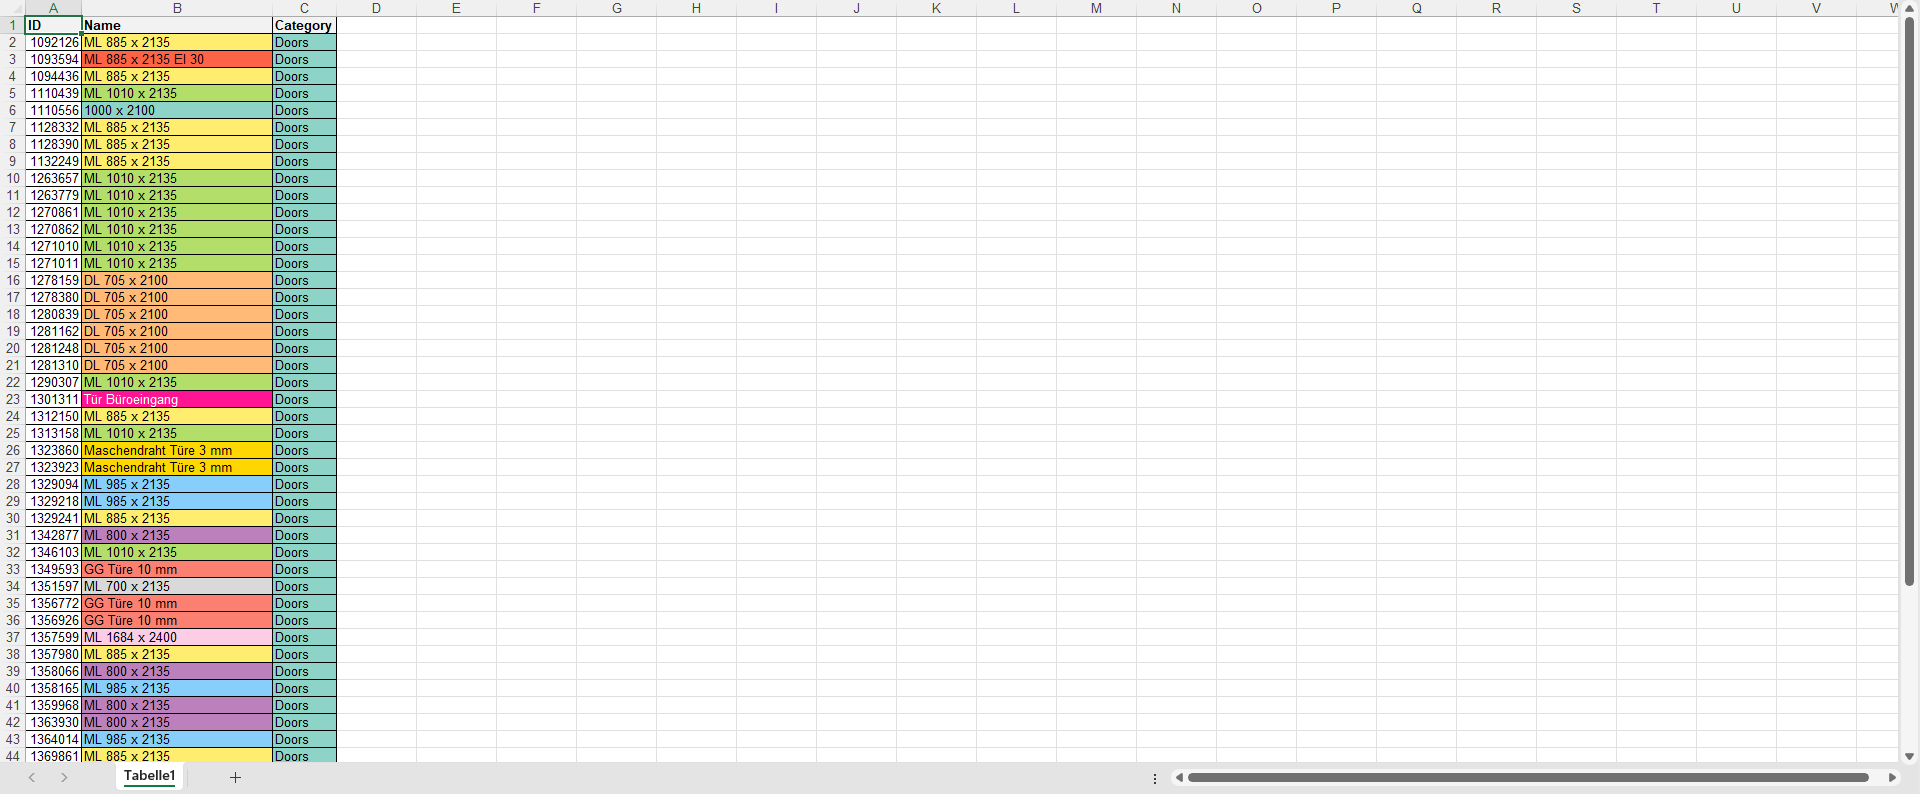
Steps:
from the top toolstrip and select CSV.